
Above the Green Line presents both daily and weekly posts to its members highlighting Investment News and Trade alerts.
Money Wave Alert! Mar, 8, 2022
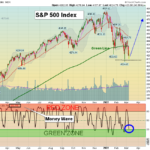
Markets tried to rally today after dumping lower in the morning. The Indices are re-testing the February Lows. The S&P 500 Index has Support at the Feb Lows of 4115, and Buying came in at 4158 but the Volume was not high. Markets need to bounce … [Read more...]
Money Wave Alert! Mar 7, 2022
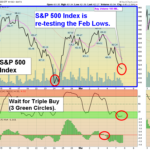
Markets were lower again today as the Indices are re-testing the February Lows. The S&P 500 Index has Support at the Feb Lows of 4115, and needs to bounce up soon to remain Bullish. Currently all of the major Index are Below the Green Lines, but … [Read more...]
Money Wave Alert! Mar 4, 2022
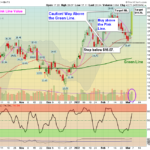
Markets were lower again today as the Indices are re-testing last week's Lows. So far all is well and the low Volume could indicate that the Selling is drying up. the S&P 500 is the only major Index that is back above the Green Line. Many are … [Read more...]
Money Wave Alert! Mar 3, 2022
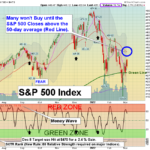
Markets were slightly lower today as the S&P 500 Index was back up in the Red Zone (probably too late to Buy for the short term). But the S&P 500 is the only major Index that is back above the Green Line. Many are waiting on the S&P 500 … [Read more...]
Money Wave Alert! Mar 2, 2022
Markets were sharply higher today as the S&P 500 Index should Close above the Pink Line (10-day avg.) That can make disciplined Short Sellers buy to close out their Short positions (they were betting on a down Market). Unfortunately most of … [Read more...]
- « Previous Page
- 1
- …
- 201
- 202
- 203
- 204
- 205
- …
- 483
- Next Page »