
Above the Green Line presents both daily and weekly posts to its members highlighting Investment News and Trade alerts.
Money Wave Alert! May 26, 2023
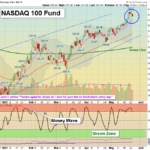
MARKETS WILL BE CLOSED ON MONDAY FOR MEMORIAL DAY HOLIDAY. Markets were higher again today as the Big Tech NASDAQ 100 Fund and Semiconductors surged up more on panic Buying and Short Covering. The rest of the Markets are not doing … [Read more...]
Money Wave Alert! May 25, 2023
Markets were mostly higher today as the Big Tech NASDAQ 100 Fund and Semiconductors surged after bouncing up off the Pink Lines (10-day avgs.). Most of the Leaders and Indices were up in the Red Zones (probably too late to Buy for the short term) … [Read more...]
Money Wave Alert! May 24, 2023
Markets were lower again today on more profit taking by the Leaders. The Big Tech NASDAQ 100 Fund and Semiconductors are coming down to the Pink Lines (10-day avgs.) where they should bounce back up. Most of the Leaders and Indices were up in … [Read more...]
Money Wave Alert! May 23, 2023
Markets were lower today on normal profit taking by the Leaders. The Big Tech NASDAQ 100 Fund and Semiconductors are coming down to the Pink Lines (10-day avgs.) where they should bounce back up. Most of the Leaders and Indices were up in the … [Read more...]
Money Wave Alert! May 22, 2023
Markets mostly were mostly higher today but the Volume was low. More profit taking on the Leaders. The Big Tech NASDAQ 100 Fund and Semiconductors are still holding up, but FOMO (Fear of Missing Out) has kicked on the Retail Investors. Most of … [Read more...]
- « Previous Page
- 1
- …
- 138
- 139
- 140
- 141
- 142
- …
- 483
- Next Page »