Above the Green Line -01
  • Market Insights
        • Commentary
          • Daily
          • Weekly
        • BUY / SELL SIGNALS
          • Trade Posts
          • Recent Trade Alerts
          • Recent Day Trades
        • BLOGROLL
          • Dividend Growth Blog
          • ETF Sector Blog
          • Dow Dogs
          • TPOW Blog
  • Strategies
        • SWING TRADING
          • Current Positions
          • Watchlists
          • Closed Positions
          • Candidates - TOP 100
          • Specialty Stocks
        • WEEKLY STOCK PICK
          • TPOW Charts
          • TPOW Performance
          • TPOW Strategy Guide
          • TPOW Performance Dashboard
        • DAY TRADING
          • Watch List
        • ATGL DASHBOARD
        • ETF STRATEGIES
          • ETF Sector Rotation
          • ETF Sector Portfolio
        • DIVIDEND GROWTH
          • Dividend Growth Portfolio
          • Dividend Calendar
        • DOGS OF THE DOW
          • Dogs of the Dow Portfolio
          • DOW 5 Portfolio
  • Markets
        • US MARKET
          • Commodities
          • Energy
          • Precious Metals
          • Volatility
        • GLOBAL MARKETS
          • Market Indices
          • Economic Calendar
          • FOREX Heat Map
          • FOREX Cross Rates
          • Crypto Currency Market
  • Investing
    • Discord Community
    • Dashboard
  • Resources
        • ARTICLES
          • Dividend Growth Model Articles
          • ETF Articles
          • Investment Strategies Articles
          • Market and Economic Insights
          • Stock Trade Articles
          • Stock Reviews
        • TOOLS
          • Stock Scanners
          • Charting Software
          • Brokerage Firms
        • STOCK CHARTS
          • Key Components
          • Reading Charts
          • Drawing Stock Charts
          • Identifying Trends
        • RETIREMENT PLANNING
  • About
    • Contact Us
    • How to Win
    • #1 At Stockcharts
    • Disclaimer
    • FAQ
  • Log In
  • Subscribe

May 22, 2023

Money Wave Alert! May 22, 2023

TLT Chart
T-Bonds are weak from end of FED Tightening soon.

Markets mostly were mostly higher today but the Volume was low. More profit taking on the Leaders.  The Big Tech NASDAQ 100 Fund and Semiconductors are still holding up, but FOMO (Fear of Missing Out) has kicked on the Retail Investors.

Most of the Leaders and Indices are back up in the Red Zones (probably too late to Buy for the short term) ,so be cautious. The FAANG Stocks (mainly AAPL GOOGL META & MSFT) are being bought for a “flight to quality”, while the Small Caps are still weak. 

Please be patient and wait for Buy Signals for ones that are still Above the Green Lines.  SOON – CHARTS  The best moves happen when the S&P 500 Index is also coming up out of the Green Zone. 

_____________________________________________________________________________

BUYS TODAY   5/22/2023        

AU      ANGLOGOLD ASHANTI LTD.        Money Wave Buy today, but AU will not be bought or logged as the Volume is below average of 3.7 MIL.

We will “Not Log” trades if the Reward/Risk is not at least 2:1, or Low Volume. These have more risk. 

BUYS TOMORROW                     

AGI      ALAMOS GOLD INC.      Buy above $12.88 with High Volume with a 3% Trailing Sell Stop Loss below it.

ARDX      ARDELYX INC.      Wait for Money Wave Close > 20 with High Volume. 

COTY      COTY INC.      Buy above the Pink Line around $11.34 with High Volume with a 3% Trailing Sell Stop Loss below it.

Shop for a better price earlier in the day with Triple Buy Signal, on the same day that a Daily Money Wave Buy Signal will occur.  

BUYS SOON              

EWW      MEXICO FUND      Wait for Money Wave Close > 20 with High Volume.        

TGTX      TG THERA.      Money Wave must Close in the Green Zone.

VIPS      VIPSHOP HOLDINGS      Wait for Money Wave Close > 20 with High Volume. 

Please be patient and Wait for Money Wave Buy Signals.  We will email you when they are ready. Follow on the WATCH LIST.   

SELLS TODAY          

DKNG      DRAFTKINGS INC.      Target was Hit at $25 for a 4.3% Gain. This trade was not logged.         

TECK      TECK RESOURCES        EXIT if it is going to Close below $42.32 Support. This trade was not logged.

___________________________________________________________________________

DAY TRADING SETUPS.  We have a new Discord Site for Live Chatting. Follow our YouTube Live Stream for quick trades. Or look for Triple Buy Pops (3 Green Circles). Movers today:   RIOT  (+9%) TARK (+10%) UPST  (+25%). Try out the Side by Side layout.      

DAY TRADING FOR INDICES & LARGE CAPS CHARTS.

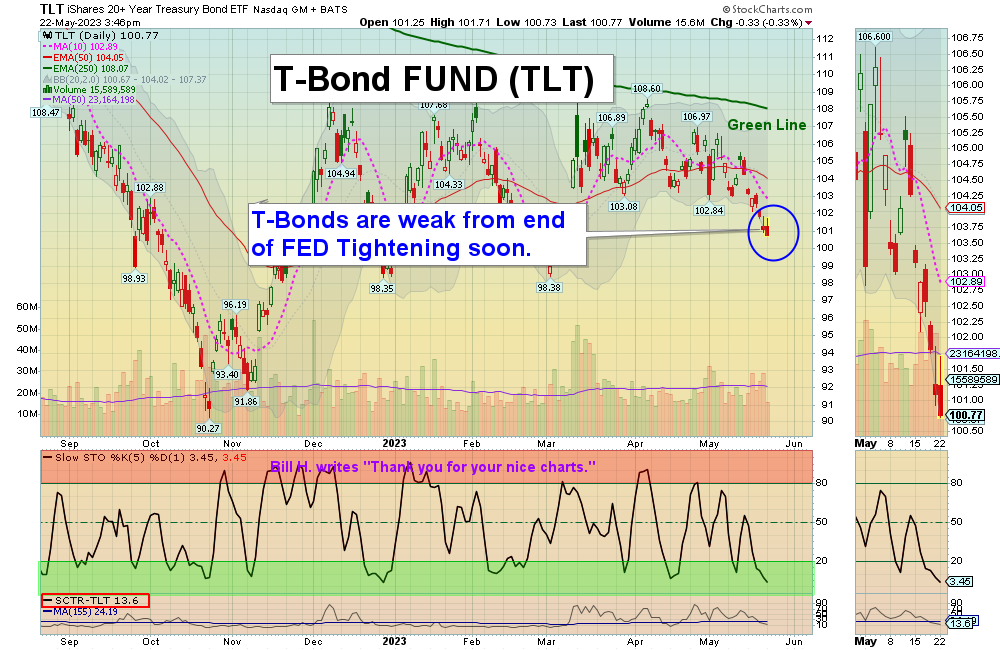
Bonds were down today and are Below the Green Line.  

Crude Oil was up $0.33 today at $72.026.

MY TRADING DASHBOARD 
SWING TRADING CURRENT POSITIONS
DAY TRADING SETUPS
TRADE ALERTS
GREEN LINE CHARTS AT STOCKCHARTS
ARE YOUR INVESTMENTS ABOVE THE GREEN LINE?
GREEN LINE RULES
ETF SECTOR ROTATION SYSTEM   
New TOP 100 LI

ST Updated May 1, 2023

Many like to Buy the Swing Trades just before the Close, if the Money Wave is going to create a Buy Signal (Closing > 20 and up out of the Green Zone). Don’t Buy if the Security has already popped up too much. Money Wave Buy Signals are usually good for a 3-6 % move in a few days.

We will “Not Log” trades if the Reward/Risk is not at least 2:1, or Low Volume. These have more risk.   

Related Post

– AU

Subscribe to Our Newsletter

AGL Logo

Get our eBook Now!

Candlestick - A Swing Traders Friend

We don’t spam! Read our privacy policy for more info.

You’ve been successfully subscribed to our newsletter!

Voted #1 at Stock Charts

SH Chart
Inverse S&P 500 Fund (SH) will have a Money Wave Buy today.

Help Us Help Animals

Help Us Help Animals

Recent Comments

  • Market Breadth Indicators: A Trader’s Guide to Early Trend Detection on Backtesting: Definition and How a Trading Strategy Backtest Works
  • Island Reversal Pattern: Definition and Formation Explained on Double Top Pattern: How to Identify and Trade This Reversal Signal
  • Channel Pattern Guide: What It Is and Why It Matters on A Guide to Forecasting Using Moving Averages
  • What Is a Broadening Bottom Chart Pattern? Full Guide on Bull vs. Bear Market: An Investor’s Guide to Market Phases
  • ATGL Weekly Money Flow - 2025-05-11 on ATGL Top Pick of the Week! Apr 6, 2025

Become a Green Liner!

Help me make more Money in the Stock Market.

ON ATGL

  • DashBoard
  • Weekly Commentary
  • Daily Buy / Sell Signals
  • Day Trade Setup
  • Trading Rooms

Design & Develop By Pixelvect

STRATEGIES

  • Swing Trading
  • ATGL Pick of the Week
  • Dividend Growth
  • ETF Sector Rotation
  • Dogs of the Dow

HELP

  • ATGL Trading Rules
  • FAQ
  • Account Maintenance
  • Contact US
  • Join

FOLLOW US

Instagram Linkedin Twitter Facebook

© COPYRIGHT 2024 · ABOVETHEGREENLINE.COM · ALL RIGHTS RESERVED · PRIVACY · TERMS · CONTACT · WATCHLIST · CURRENT