
The Top Pick of the Week for November 28, 2025, was RGTI, selected for its exceptional technical strength and alignment with the core Above the Green Line methodology. The trade opened on November 24, 2025, at $23.72 and closed the same day at $24.67, producing a gain of 4.01% for the week. This move came directly off a clean Money Wave setup, supported by strong volume expansion and a rising SCTR score well above the 90 threshold that signals institutional interest. The chart for RGTI clearly reflected a stock breaking out from consolidation while maintaining leadership relative to the broader market.
Market conditions added important context to this week’s performance. Even with the shortened Thanksgiving week, the major indices—particularly the S&P 500 (SPY)—showed impressive resilience. SPY pushed higher in a slow, controlled uptrend while holding comfortably above its Green Line support area. Although volume was lighter due to the holiday, the underlying bid remained firm, suggesting that large investors are positioning for the historically strong month of December. Sector rotation also played a role, with select technology and growth names leading early in the week, and cyclicals firming up toward the end. In this environment, leadership stocks like RGTI tended to outperform as traders focused on strength and clean technical structures.
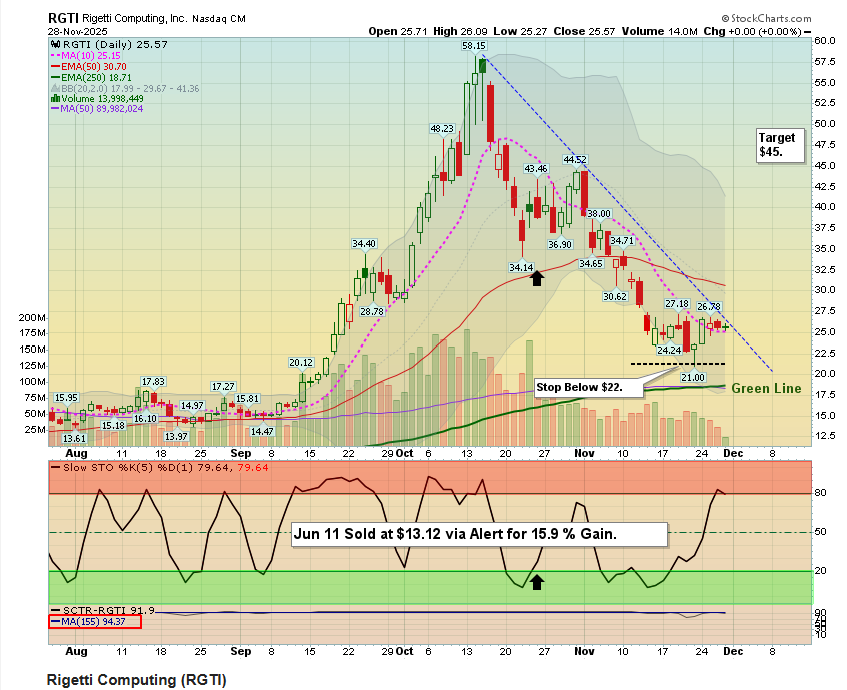
What stood out most about the RGTI setup was its combination of momentum, relative strength, and a favorable Money Wave pattern. The stock launched from a well-defined support zone, stayed above its Green Line, and demonstrated clear evidence of smart-money accumulation. This is exactly the type of setup the TPOW framework is designed to capture—high-probability trades that are technically sound and supported by stronger-than-average market conditions. The resulting gain for the week reflected disciplined execution and adherence to rules, emphasizing once again that the best trades develop when price, momentum, and volume align. And for our more aggressive traders who held the position through Friday’s close, RGTI delivered an impressive 7.8% return for the week.
To help members evaluate each TPOW candidate more effectively, several performance visuals and metrics are included. The RGTI chart highlights the breakout, Money Wave reversal, and volume confirmation that justified the selection. A weekly performance snapshot shows the 4.01% gain, providing transparency that keeps the strategy easy to follow. Members can also review the running comparison between TPOW performance and the S&P 500, which continues to show TPOW’s relative advantage in weeks where leadership stocks outperform the broader market. For longer-term perspective, the TPOW equity curve and rolling averages demonstrate how consistent weekly gains compound meaningfully over time.
Each week, the TPOW post also reinforces foundational principles of the strategy. Staying above the Green Line, choosing only the strongest stocks, and following a rules-based approach are what drive long-term success. This week’s trade in RGTI was another reminder that patience and discipline pay off, especially in markets where leadership is narrow and opportunities emerge primarily in high-quality setups rather than broad-market surges. With December seasonality approaching and SPY holding near highs, conditions remain constructive for momentum-based swing trading, provided entries are selective and follow well-defined signals.
Looking ahead, the focus will continue to be on stocks exhibiting strong relative strength, high SCTR scores, and clean Money Wave patterns. These characteristics consistently produce the most reliable trades within the TPOW methodology. As always, members should remain disciplined, avoid emotional decision-making, and rely on the proven, repeatable process that defines Above the Green Line trading.
To understand why this weekly approach compounds differently than buy-and-hold investing, see The Long-Term Advantage of Weekly Stock Selection
