
Top Pick of the Week (TPOW) – Weekly Review
The Top Pick of the Week (TPOW) strategy closed out the week ending March 27, 2026 with a loss, as the selected stock for the week, ASE Technology Holding Co. (NYSE: ASX), was unable to overcome a challenging macro environment that weighed heavily on the broader market and the semiconductor sector in particular.
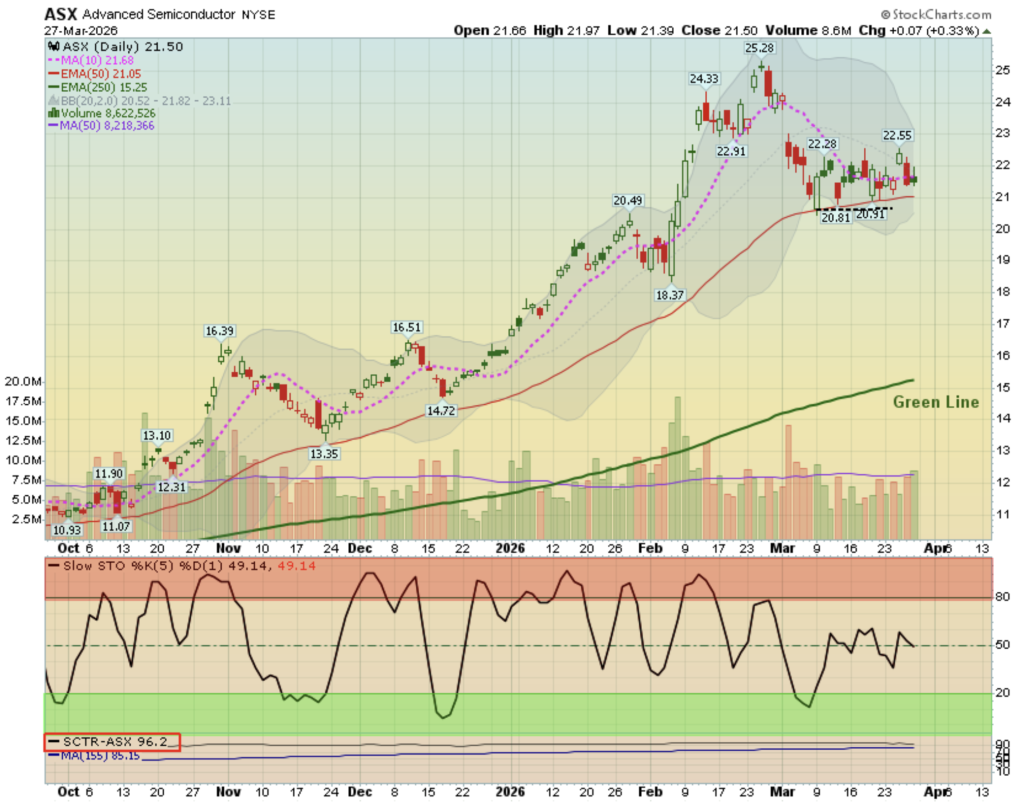
The position was opened on Monday, March 16 at an open price of $22.00. By Friday, March 27, ASX closed at $21.50, resulting in a loss of $0.50 per share and a -2.27% return for the week. The TPOW balance at the close of this trade stood at $35,535.04.
This outcome reflects the reality that even technically sound setups can be overwhelmed by macro forces beyond the control of any individual trade. The TPOW framework is built on disciplined entries, predefined risk management, and repeatable process — not on predicting geopolitical events or oil market disruptions. Not every trade will produce a gain, and this week is a reminder that protecting capital during difficult market conditions is part of the long-term edge.
Market Summary — Week Ending March 27, 2026
The week ending March 27 was another difficult one for U.S. equity markets. Oil supply fears wreaked havoc on markets as approximately 17.8 million barrels per day of oil that should have flowed through the Strait of Hormuz was disrupted keeping energy prices elevated and investor sentiment deeply cautious. President Trump extended the Iran negotiations deadline by 10 days to April 6, 2026 which provided some temporary relief mid-week but was not enough to reverse the prevailing negative tone.
The S&P 500 is down 7.4% for March, with the decline accelerating as large caps, especially the Magnificent Seven, drove losses. Investors rotated out of large-cap growth and AI hyperscalers, with energy, materials, utilities, and consumer staples outperforming.
The S&P 500 finished the week at its lowest level in over seven months and is now approaching correction territory, sitting approximately 8.74% off its all-time high from January 27, 2026. This is the index’s fourth consecutive down week — a streak that reflects the combination of persistent geopolitical pressure, sticky inflation concerns, and a Federal Reserve holding rates steady in the face of rising energy costs.
Technology stocks were particularly vulnerable during this stretch. The semiconductor sector, which had been one of the market’s strongest performers heading into 2026, came under broad pressure as risk appetite dried up and institutional money rotated toward defensive positioning.
SPY Performance
SPY traded at $634.09 on March 29, 2026, with its 52-week range spanning from $481.80 to $697.84. The ETF has pulled back sharply from its all-time high near $697.84 set in late January, representing a decline of roughly 9% from peak levels as of the close of the week.
SPY has pulled back sharply to around $634, approximately 9% below its January 2026 all-time high near $693, as surging oil prices amid Middle East geopolitical tensions and a $300 billion wipeout in Magnificent Seven stocks triggered the index’s longest losing streak since 2022.
Technically, SPY is trading below its key short-term moving averages and has broken through several support levels that had held during the earlier part of the year. The 52-week low of $481.80, set during last April’s Liberation Day lows, remains a distant reference point, but the current pace of decline warrants continued caution. The YTD return for SPY now sits at approximately -3.68%, erasing the gains that had been accumulated in the early weeks of 2026.
ASX Trade Context
ASE Technology Holding Co. (NYSE: ASX) is the world’s leading provider of semiconductor packaging and testing services, with operations spanning the United States, Taiwan, Asia, and Europe. The company is well positioned as a beneficiary of accelerating AI infrastructure demand, with its advanced packaging capabilities in high demand from major chip designers. At the time of selection, ASX met the key TPOW criteria with strong relative strength, favorable momentum, and a technical structure consistent with the strategy’s focus on stocks trading above the Green Line with institutional support.
The trade was entered at $22.00 on March 16 as ASX demonstrated the kind of controlled technical setup the TPOW framework looks for at the start of a trading week. However, the headwinds facing the semiconductor sector during the week — driven by broad market weakness, geopolitical uncertainty, and risk-off positioning in technology — prevented the stock from holding its ground and building toward the target. The position was closed at $21.50 on March 27, reflecting a disciplined exit in line with the strategy’s risk management parameters.
Looking Ahead
The market environment entering the week of March 30 remains uncertain. Key catalysts in the coming days include the advance Q1 GDP estimate and March nonfarm payrolls — released pre-Good Friday market close — which could shift April FOMC rate cut probabilities and break the current oversold sentiment. Geopolitical developments around the Iran negotiations and the April 6 deadline remain the dominant macro wildcard.
For the TPOW strategy, the focus remains unchanged: identify stocks demonstrating the strongest technical setups relative to the broader market, apply disciplined entry and exit rules, and let the process work over time. Weeks like this one are part of the equation. The strategy does not win every trade — it wins consistently over a full cycle by keeping losses controlled and letting winners run when conditions align.
The discipline that protects capital in down weeks is the same discipline that captures gains in stronger ones.
The Top Pick of the Week (TPOW) is part of the rules-based investing framework used at Above the Green Line. Each week a stock meeting strict technical criteria is selected and managed using predefined entry and exit rules. Learn more about the methodology in our Investment Strategies guide and view historical results on our Weekly Stock Pick Strategy page.
