Above the Green Line -01
  • Market Insights
        • Commentary
          • Daily
          • Weekly
        • BUY / SELL SIGNALS
          • Trade Posts
          • Recent Trade Alerts
          • Recent Day Trades
        • BLOGROLL
          • Dividend Growth Blog
          • ETF Sector Blog
          • Dow Dogs
          • TPOW Blog
  • Strategies
        • SWING TRADING
          • Current Positions
          • Watchlists
          • Closed Positions
          • Candidates - TOP 100
          • Specialty Stocks
        • WEEKLY STOCK PICK
          • TPOW Charts
          • TPOW Performance
          • TPOW Strategy Guide
          • TPOW Performance Dashboard
        • DAY TRADING
          • Watch List
        • ATGL DASHBOARD
        • ETF STRATEGIES
          • ETF Sector Rotation
          • ETF Sector Portfolio
        • DIVIDEND GROWTH
          • Dividend Growth Portfolio
          • Dividend Calendar
        • DOGS OF THE DOW
          • Dogs of the Dow Portfolio
          • DOW 5 Portfolio
  • Markets
        • US MARKET
          • Commodities
          • Energy
          • Precious Metals
          • Volatility
        • GLOBAL MARKETS
          • Market Indices
          • Economic Calendar
          • FOREX Heat Map
          • FOREX Cross Rates
          • Crypto Currency Market
  • Investing
    • Discord Community
    • Dashboard
  • Resources
        • ARTICLES
          • Dividend Growth Model Articles
          • ETF Articles
          • Investment Strategies Articles
          • Market and Economic Insights
          • Stock Trade Articles
          • Stock Reviews
        • TOOLS
          • Stock Scanners
          • Charting Software
          • Brokerage Firms
        • STOCK CHARTS
          • Key Components
          • Reading Charts
          • Drawing Stock Charts
          • Identifying Trends
        • RETIREMENT PLANNING
  • About
    • Contact Us
    • How to Win
    • #1 At Stockcharts
    • Disclaimer
    • FAQ
  • Log In
  • Subscribe

October 6, 2016

Thursday Oct 6, 2016

Money Wave Buy soon on JR Gold Miners GDXJ
Money Wave Buy soon on Jr Gold Miners GDXJ


10/06 /2016:  Markets were mixed today as the US Dollar popped up more on a possible Fed Raise later this year. The S&P 500 closed back above the Red Line (50-day average), but Bonds were down.  Oil has had a big run after the OPEC cut.

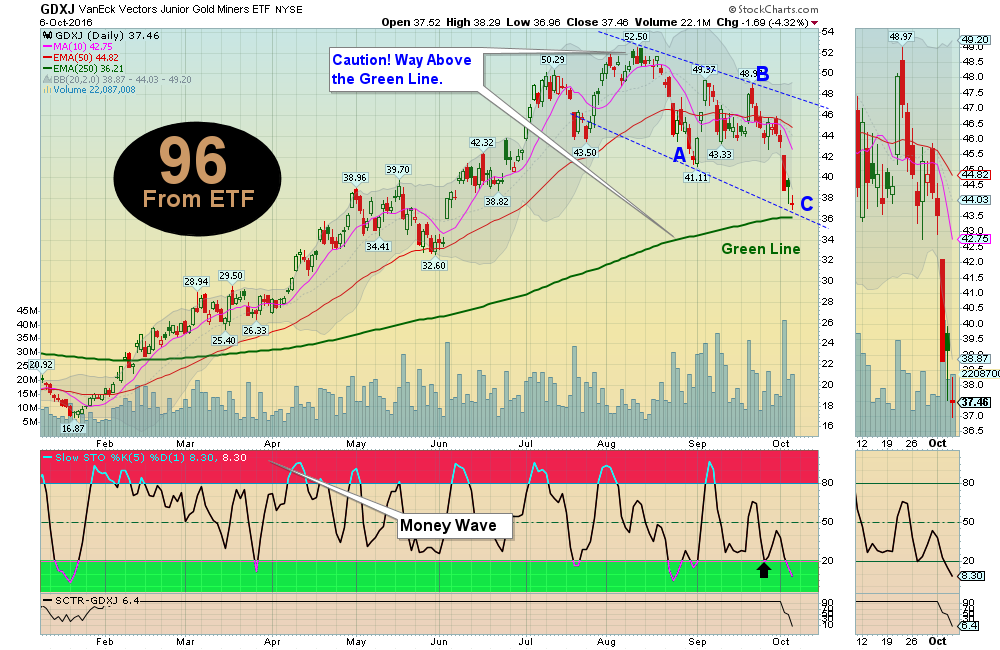
If the Gold Miners can bounce around the Green Lines soon, they could make it back up to the August Highs again in a few months… Don’t forget that GDX Weekly was $66 just 4 years ago ( now $23.00). We might Buy GDX for a  Long Term Buy soon.

Money Wave Buys soon for GDXJ GORO GRUB &  VEEV    We will email you when they are ready. Watch List

Caution! Most investments are currently very over-bought and in the Red Zones. Wait for Green Zone Buys.   

Current Open Positions   Closed Positions      Charts for Leaders 


Alert! Market Risk High (Red Zone). The probability of successful Short Term Trades is lower, when the S&P 500 is Way Above the Green Line. Even the Strongest Funds can get chopped up. Either take quick gains from Money Wave Pops, or STAY IN CASH & WAIT for a larger correction.


QUESTIONS: Anthony asks:  But don’t you send out “Sell” emails too?

ANSWER:   Thank you for your comments, Anthony.

The Rules need to be clarified… there are 3 Sell Stop Categories after an Investment has been bought.

1. Immediately after Buy, place Sell Stop below the recent “Swing Low” (Support).

2. After the Money Wave > 50, if it is going to CLOSE below where you Bought it, GET OUT!

3. When the Money Wave > 80, if it is going to CLOSE below the Pink Line (10-day avg.) GET OUT!

Please keep the Current Open Positions link handy (it is in your emails, and on the menu of web site).

This link is now Color Coded… THE STOP LOSS column is kept current… It Row is Yellow or Red, EXIT if it is 
going to CLOSE below that value.

We are working on a System to implement this into the Intra-day emails.

Thank you.


Related Post

– Tuesday Oct 4, 2016

Subscribe to Our Newsletter

AGL Logo

Get our eBook Now!

Candlestick - A Swing Traders Friend

We don’t spam! Read our privacy policy for more info.

You’ve been successfully subscribed to our newsletter!

Voted #1 at Stock Charts

SH Chart
Inverse S&P 500 Fund (SH) will have a Money Wave Buy today.

Help Us Help Animals

Help Us Help Animals

Recent Comments

  • Market Breadth Indicators: A Trader’s Guide to Early Trend Detection on Backtesting: Definition and How a Trading Strategy Backtest Works
  • Island Reversal Pattern: Definition and Formation Explained on Double Top Pattern: How to Identify and Trade This Reversal Signal
  • Channel Pattern Guide: What It Is and Why It Matters on A Guide to Forecasting Using Moving Averages
  • What Is a Broadening Bottom Chart Pattern? Full Guide on Bull vs. Bear Market: An Investor’s Guide to Market Phases
  • ATGL Weekly Money Flow - 2025-05-11 on ATGL Top Pick of the Week! Apr 6, 2025

Become a Green Liner!

Help me make more Money in the Stock Market.

ON ATGL

  • DashBoard
  • Weekly Commentary
  • Daily Buy / Sell Signals
  • Day Trade Setup
  • Trading Rooms

Design & Develop By Pixelvect

STRATEGIES

  • Swing Trading
  • ATGL Pick of the Week
  • Dividend Growth
  • ETF Sector Rotation
  • Dogs of the Dow

HELP

  • ATGL Trading Rules
  • FAQ
  • Account Maintenance
  • Contact US
  • Join

FOLLOW US

Instagram Linkedin Twitter Facebook

© COPYRIGHT 2024 · ABOVETHEGREENLINE.COM · ALL RIGHTS RESERVED · PRIVACY · TERMS · CONTACT · WATCHLIST · CURRENT