Accumulation Distribution Line
Developed by Marc Chaikin, the Accumulation Distribution Line is a volume-based indicator designed to measure the cumulative flow of money into and out of a security.
KEY TAKEWAYS
- The accumulation/distribution line gauges supply and demand by looking at where the price closed within the period’s range, and then multiplying that by volume.
- The A/D indicator is cumulative, meaning one period’s value is added or subtracted from the last.
- A rising A/D line helps confirm a rising price trend.
- A falling A/D line helps confirm a price downtrend.
- If the price is rising but A/D is falling, it signals underlying weakness and a potential decline in price.
- If the price of an asset is falling but A/D is rising, it signals underlying strength and the price may start to rise.
The calculation of the Accumulation/Distribution Line is based on three key parts:
- Money Flow Multiplier : fluctuates between +1 and -1 and thus dictates the direction
- Money Flow Volume
- ADL
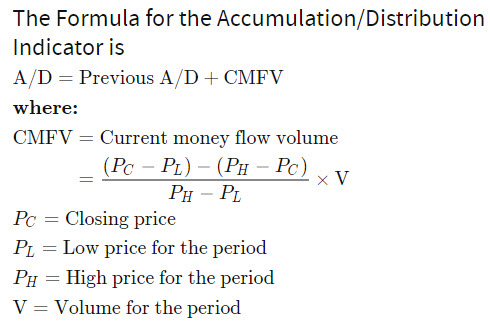
Calculation of the Accumulation Distribution Line is shown in the figure below.

- Start by calculating the multiplier. Note the most recent period’s close, high, and low to calculate.
- Use the multiplier and the current period’s volume to calculate the Money Flow Volume.
- Add the Money Flow Volume to the last A/D value. For the first calculation use Money Flow Volume as the first value.
- Repeat the process as each period ends, adding/subtracting the new Money Flow Volume to/from the prior total. This is A/D.
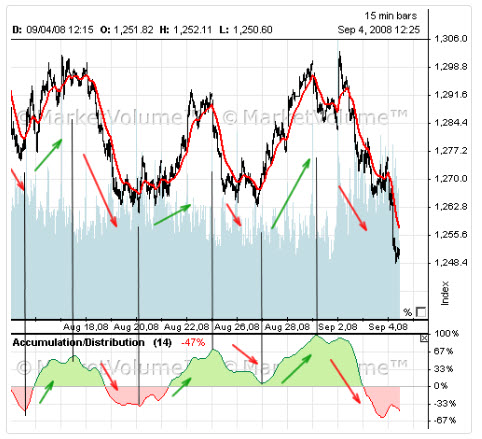
Highlighted in the figure below is the Accumulation / Distribution Line for the S&P 500 Index.

Final Thoughts
The Accumulation Distribution Line can be used to gauge the general flow of volume. An uptrend indicates that buying pressure is prevailing on a regular basis, while a downtrend indicates that selling pressure is prevailing. Bullish and bearish divergences serve as alerts for a potential reversal on the price chart. As with all indicators, it is important to use the Accumulation Distribution Line in conjunction with other aspects of technical analysis, such as momentum oscillators and chart patterns. It is not a standalone indicator.