Above the Green Line -01
  • Market Insights
        • Commentary
          • Daily
          • Weekly
        • BUY / SELL SIGNALS
          • Trade Posts
          • Recent Trade Alerts
          • Recent Day Trades
        • BLOGROLL
          • Dividend Growth Blog
          • ETF Sector Blog
          • Dow Dogs
          • TPOW Blog
  • Strategies
        • SWING TRADING
          • Current Positions
          • Watchlists
          • Closed Positions
          • Candidates - TOP 100
          • Specialty Stocks
        • WEEKLY STOCK PICK
          • TPOW Charts
          • TPOW Performance
          • TPOW Strategy Guide
          • TPOW Performance Dashboard
        • DAY TRADING
          • Watch List
        • ATGL DASHBOARD
        • ETF STRATEGIES
          • ETF Sector Rotation
          • ETF Sector Portfolio
        • DIVIDEND GROWTH
          • Dividend Growth Portfolio
          • Dividend Calendar
        • DOGS OF THE DOW
          • Dogs of the Dow Portfolio
          • DOW 5 Portfolio
  • Markets
        • US MARKET
          • Commodities
          • Energy
          • Precious Metals
          • Volatility
        • GLOBAL MARKETS
          • Market Indices
          • Economic Calendar
          • FOREX Heat Map
          • FOREX Cross Rates
          • Crypto Currency Market
  • Investing
    • Discord Community
    • Dashboard
  • Resources
        • ARTICLES
          • Dividend Growth Model Articles
          • ETF Articles
          • Investment Strategies Articles
          • Market and Economic Insights
          • Stock Trade Articles
          • Stock Reviews
        • TOOLS
          • Stock Scanners
          • Charting Software
          • Brokerage Firms
        • STOCK CHARTS
          • Key Components
          • Reading Charts
          • Drawing Stock Charts
          • Identifying Trends
        • RETIREMENT PLANNING
  • About
    • Contact Us
    • How to Win
    • #1 At Stockcharts
    • Disclaimer
    • FAQ
  • Log In
  • Subscribe

Slow Stochastic Oscillator

Slow Stochastic Oscillator

The Slow Stochastic Oscillator is a smoothed version of the Fast Stochastic and is less sensitive to price fluctuations. It is calculated by applying a further smoothing process to the %K line of the Fast Stochastic. In the Slow Stochastic:

  1. %K is a 3-day moving average of the Fast Stochastic’s %K.
  2. %D is a 3-day moving average of the Slow Stochastic’s %K.

Because of this extra smoothing, the Slow Stochastic produces fewer signals, making it more appropriate for traders with a longer time horizon who want to avoid the noise of small, quick price movements. It’s generally more reliable in trending markets where volatility is lower.

The Slow Stochastic is scaled from 0 to 100. Readings above 80 are considered overbought, suggesting that the asset may be due for a price reversal or pullback while Readings below 20 are considered oversold, indicating that the asset may be undervalued and could experience a potential upward reversal.

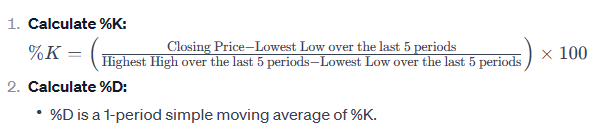
The basic formula for the Slow Stochastic %K is:

How to Use: The Slow Stochastic is used similarly to the Fast version, but with more emphasis on reducing false signals. Traders look for crossovers of %K and %D to indicate buying and selling opportunities. Because it produces fewer signals, it’s typically favored by swing traders or those who are aiming for medium-term trades rather than short-term scalps.

Crossings above 80 might suggest that the market is overbought and due for a pullback, while crossings below 20 might suggest that the market is oversold and due for a potential rebound.
The Slow Stochastic is a popular tool among technical analysts for its ability to help identify potential reversals in market momentum. Traders often use it in conjunction with other technical indicators and analysis methods for a more comprehensive understanding of market conditions.


Related Articles

Trading Halts

Trading Halts Explained: How Long Do They Last and How to Manage Them Completed

When chaos looms in the financial markets, trading halts operate as a crucial pause button. These temporary stops in trading ...
Read More
Understanding Volatility in the market

Understanding the VIX: How Volatility Index Affects Stocks

When stock market turbulence strikes, and investor emotions fluctuate like a roller coaster, market volatility becomes a pressing concern. Traders ...
Read More
Harmonic Patterns

Harmonic Patterns in Stock Trading: Master the Best Setups

Spotting market reversals is crucial for traders aiming to maximize profits, and technical patterns serve as invaluable tools in this ...
Read More
Elliott Wave Pattern

Unlock the Power of the Elliott Wave Pattern: A Blueprint for Predicting Trends

One of the biggest challenges for investors is accurately timing market entries and exits. Traditional indicators often lag price action ...
Read More
Three Drive Pattern

Spot the Three Drives Pattern: Your Key to Capturing Major Market Moves

Technical patterns provide traders with visual representations of market psychology and price action dynamics. The three drives pattern stands out ...
Read More
Diamond Top Pattern

How to Recognize and Trade the Diamond Top Pattern

Technical analysis provides traders with powerful tools to interpret market movements and anticipate price action. Among chart formations, the diamond ...
Read More

Subscribe to Our Newsletter

AGL Logo

Get our eBook Now!

Candlestick - A Swing Traders Friend

We don’t spam! Read our privacy policy for more info.

You’ve been successfully subscribed to our newsletter!

Voted #1 at Stock Charts

SH Chart
Inverse S&P 500 Fund (SH) will have a Money Wave Buy today.

Help Us Help Animals

Help Us Help Animals

Recent Comments

  • ATGL Weekly Money Flow - 2025-07-13 on AGTL Top Pick of the Week! May 11, 2025
  • Market Breadth Indicators: A Trader’s Guide to Early Trend Detection on Backtesting: Definition and How a Trading Strategy Backtest Works
  • Island Reversal Pattern: Definition and Formation Explained on Double Top Pattern: How to Identify and Trade This Reversal Signal
  • Channel Pattern Guide: What It Is and Why It Matters on A Guide to Forecasting Using Moving Averages
  • What Is a Broadening Bottom Chart Pattern? Full Guide on Bull vs. Bear Market: An Investor’s Guide to Market Phases

Become a Green Liner!

Help me make more Money in the Stock Market.

ON ATGL

  • DashBoard
  • Weekly Commentary
  • Daily Buy / Sell Signals
  • Day Trade Setup
  • Trading Rooms

Design & Develop By Pixelvect

STRATEGIES

  • Swing Trading
  • ATGL Pick of the Week
  • Dividend Growth
  • ETF Sector Rotation
  • Dogs of the Dow

HELP

  • ATGL Trading Rules
  • FAQ
  • Account Maintenance
  • Contact US
  • Join

FOLLOW US

Instagram Linkedin Twitter Facebook

© COPYRIGHT 2024 · ABOVETHEGREENLINE.COM · ALL RIGHTS RESERVED · PRIVACY · TERMS · CONTACT · WATCHLIST · CURRENT