Above the Green Line -01
  • Market Insights
        • Commentary
          • Daily
          • Weekly
        • BUY / SELL SIGNALS
          • Trade Posts
          • Recent Trade Alerts
          • Recent Day Trades
        • BLOGROLL
          • Dividend Growth Blog
          • ETF Sector Blog
          • Dow Dogs
          • TPOW Blog
  • Strategies
        • SWING TRADING
          • Current Positions
          • Watchlists
          • Closed Positions
          • Candidates - TOP 100
          • Specialty Stocks
        • WEEKLY STOCK PICK
          • TPOW Charts
          • TPOW Performance
          • TPOW Strategy Guide
          • TPOW Performance Dashboard
        • DAY TRADING
          • Watch List
        • ATGL DASHBOARD
        • ETF STRATEGIES
          • ETF Sector Rotation
          • ETF Sector Portfolio
        • DIVIDEND GROWTH
          • Dividend Growth Portfolio
          • Dividend Calendar
        • DOGS OF THE DOW
          • Dogs of the Dow Portfolio
          • DOW 5 Portfolio
  • Markets
        • US MARKET
          • Commodities
          • Energy
          • Precious Metals
          • Volatility
        • GLOBAL MARKETS
          • Market Indices
          • Economic Calendar
          • FOREX Heat Map
          • FOREX Cross Rates
          • Crypto Currency Market
  • Investing
    • Discord Community
    • Dashboard
  • Resources
        • ARTICLES
          • Dividend Growth Model Articles
          • ETF Articles
          • Investment Strategies Articles
          • Market and Economic Insights
          • Stock Trade Articles
          • Stock Reviews
        • TOOLS
          • Stock Scanners
          • Charting Software
          • Brokerage Firms
        • STOCK CHARTS
          • Key Components
          • Reading Charts
          • Drawing Stock Charts
          • Identifying Trends
        • RETIREMENT PLANNING
  • About
    • Contact Us
    • How to Win
    • #1 At Stockcharts
    • Disclaimer
    • FAQ
  • Log In
  • Subscribe

August 20, 2016

Saturday Aug 20, 2016 Weekly

Best Time to Buy is in the Green Zone!

08/20/2016 Weekly Commentary:  Markets were mixed for the week, as major Indices are still holding above the Pink Lines (10-day avgs.) S&P 500 must exceed the 2194 high of last week, or selling could come in.  Looks like the S&P 500 is about to complete Wave 5 up, since the bounce off the Green Line in late June.  After Wave 5 up is complete, the S&P 500 should drop down to test Support around 2130.

We got stopped out of all 4 positions on Friday (Steel & Metals) and some readers were asking how to avoid this chopping action…

We are in the 7th year of an aging Bull (2nd longest in history).. Our Short Term Trading System normally loses at least 1/3 of the time (Casinos lose about 46% of the time, and still make lots of Money), and the Green Line System normally wins overall, also).

We have been warning Followers that Buying when Markets are Way Above the Green Line is a poor bet, even with the very Strongest Funds.

Next Home Runs or Doubles will probably NOT BE in STOCK OR BOND FUNDS… It will probably Inverse Funds or Commodity Funds. ( Coal, Copper, Gasoline, Oil, Steel, etc, but they don’t meet the Rules, yet).

But in the meantime, many of our Followers want Short Term Action.

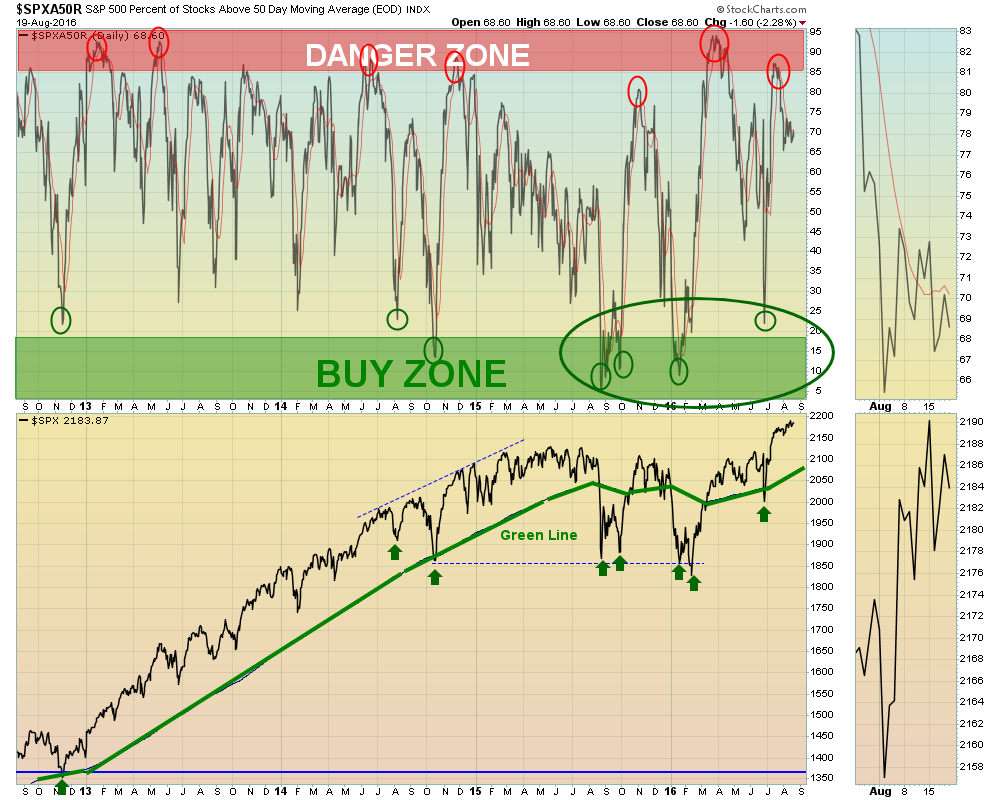
When you Buy, is as important as What you Buy.  The Chart above has been working great, if you only Buy in or near the Green BUY Zone.

If you don’t want lots of chopping action like now when Markets are Way Above the Green Line, WAIT for the S&P 500 to return to the Green Line, or WAIT for Green BUY Zones on the Chart Above.

Current Open Positions  Money Wave Buy on Friday for  ALB.
Soon for  AG   CLF  &  ONVO  We will email you when they are ready.

Alert! Market Risk High. The probability of successful Short Term Trades is lower, when the S&P 500 is Way Above the Green Line. Even the Strongest Funds can get chopped up. Either take quick gains from Money Wave Pops, or STAY IN CASH & WAIT for a larger correction.

“Real Time” Charts for Today

Related Post

– Thursday Aug 18, 2016

Subscribe to Our Newsletter

AGL Logo

Get our eBook Now!

Candlestick - A Swing Traders Friend

We don’t spam! Read our privacy policy for more info.

You’ve been successfully subscribed to our newsletter!

Voted #1 at Stock Charts

SH Chart
Inverse S&P 500 Fund (SH) will have a Money Wave Buy today.

Help Us Help Animals

Help Us Help Animals

Recent Comments

  • Market Breadth Indicators: A Trader’s Guide to Early Trend Detection on Backtesting: Definition and How a Trading Strategy Backtest Works
  • Island Reversal Pattern: Definition and Formation Explained on Double Top Pattern: How to Identify and Trade This Reversal Signal
  • Channel Pattern Guide: What It Is and Why It Matters on A Guide to Forecasting Using Moving Averages
  • What Is a Broadening Bottom Chart Pattern? Full Guide on Bull vs. Bear Market: An Investor’s Guide to Market Phases
  • ATGL Weekly Money Flow - 2025-05-11 on ATGL Top Pick of the Week! Apr 6, 2025

Become a Green Liner!

Help me make more Money in the Stock Market.

ON ATGL

  • DashBoard
  • Weekly Commentary
  • Daily Buy / Sell Signals
  • Day Trade Setup
  • Trading Rooms

Design & Develop By Pixelvect

STRATEGIES

  • Swing Trading
  • ATGL Pick of the Week
  • Dividend Growth
  • ETF Sector Rotation
  • Dogs of the Dow

HELP

  • ATGL Trading Rules
  • FAQ
  • Account Maintenance
  • Contact US
  • Join

FOLLOW US

Instagram Linkedin Twitter Facebook

© COPYRIGHT 2024 · ABOVETHEGREENLINE.COM · ALL RIGHTS RESERVED · PRIVACY · TERMS · CONTACT · WATCHLIST · CURRENT