Above The Green Line

  • Commentary
    • BUY / SELL SIGNALS
      • Stock Alerts
    • DIVGRO BLOG
    • ETF SECTOR BLOG
    • DOW DOGS BLOG
    • NEWS
    • STOCK IDEAS
  • Strategies
    • SWING TRADING
      • CURRENT POSITIONS
      • WATCHLISTS
      • CLOSED POSITIONS
      • CANDIDATES – TOP 100
      • SPECIALTY STOCKS
    • DAY TRADING
      • Watch List
    • DIVIDEND GROWTH
      • Dividend Growth Portfolio
      • Dividend Calendar
    • DOGS OF THE DOW
      • Dogs of the Dow Portfolio
      • DOW 5 Portfolio
    • ETF SECTOR ROTATION
      • ETF Sector Portfolio
  • Markets
    • US MARKET
      • Commodities
      • Energy
      • Precious Metals
      • Volatility
    • GLOBAL MARKETS
      • MARKET INDICES
      • ECONOMIC CALENDAR
      • FOREX HEAT MAP
      • FOREX CROSS RATES
      • CRYPTOCURRENCY MARKET
    • DASHBOARD
    • IDEAS
  • Investing
    • FORUM
  • Resources
    • ARTICLES
    • WEEKLY STOCK
    • RETIREMENT PLANNING
    • BLOGROLL
    • FAQ
  • About
    • CONTACT US
    • HOW TO WIN
    • #1 AT STOCKCHARTS
  • Log In
  • Subscribe

August 13, 2016

Saturday Aug 13, 2016

08/13/2016 Weekly Commentary:  Markets held above the Pink Lines (10-day avgs.) all week…  Looks like the S&P 500 is about to complete Wave 5 up, since the bounce off the Green Line in late June.

The Inverse VIX XIV and Small Caps IWM were not able to make new Highs this time up, indicating exhaustion. After Wave 5 up is complete, the S&P 500 should drop down to test Support around 2130.

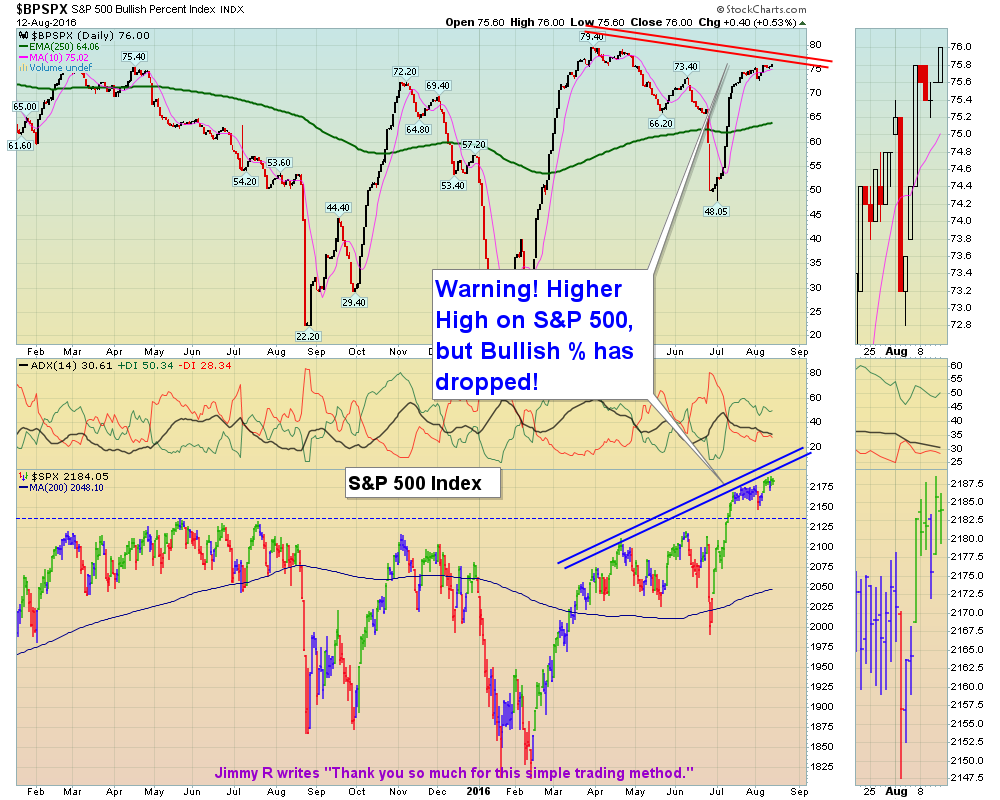
There are plenty of divergences indicating a narrowing, and topping Market (See Chart Above), but it has not mattered with the super low Interest Rates.  It will normally take more upward action from rising Commodities prices, to crack the Bond Markets.

Current Open Positions  Nimble traders should have plenty of Cash for a pull-back soon, as we sold our last position Nintendo NTDOY on Friday for a 6.4% gain..

Money Wave Buys soon for AKS   CLF  FCX RICE  X  XME &   Z   We will email you when they are ready.

When the Market breadth is narrow like it is now (few new highs), either take quick gains from Money Wave Pops, or STAY IN CASH & WAIT for a larger correction.

“Real Time” Charts for Today

Divergences are showing Weakness on Markets!

Posted By AbovetheGreenLine at 8:09 pm 4 Comments

Comments

  1. VolatilitySquared says

    August 13, 2016 at 9:54 pm

    Current S&P multiplies also “stretched”. No sale there either.

    Log in to Reply
  2. zceat says

    August 14, 2016 at 7:50 pm

    would appreciate a live link to $BPSPX

    Log in to Reply
    • AbovetheGreenLine says

      August 14, 2016 at 8:48 pm

      Chart of Bullish % of S&P 500.

      Log in to Reply
      • zceat says

        August 15, 2016 at 8:03 am

        TY

        Log in to Reply

Leave a Reply Cancel reply

You must be logged in to post a comment.

Voted #1 at Stock Charts

SH Chart
Inverse S&P 500 Fund (SH) will have a Money Wave Buy today.

Help Us Help Animals

Help Us Help Animals

Recent Comments

  • Money Wave Alert! Mar 29, 2023 – InvFuture Education on Money Wave Alert! Mar 29, 2023
  • Money Wave Alert! Mar 28, 2023 – InvFuture Education on Money Wave Alert! Mar 28, 2023
  • Viking Thera. (VKTX) up 58% today. – InvFuture Education on Viking Thera. (VKTX) up 58% today.
  • Money Wave Alert! Mar 27, 2023 – InvFuture Education on Money Wave Alert! Mar 27, 2023
  • Green Line Weekly! Mar 26, 2023 – InvFuture Education on Green Line Weekly! Mar 26, 2023

Become a Green Liner!

Help me make more Money in the Stock Market.

Above the Green Line

ON ATGL

  • Weekly Commentary
  • Intraday Buy / Sells
  • Day Trade Setup

STRATEGIES

  • Swing Trading
  • Dividend Growth
  • ETF Sector Rotation
  • Dogs of the Dow

HELP

  • ATGL Trading Rules
  • FAQ
  • Account Maintenance
  • Contact US

© Copyright 2021 · AboveTheGreenLine.com · All Rights Reserved · Privacy · Terms · Contact · WatchList · Current