
Price Ladder and Swing Trading
The price ladder, also known as the Depth of Market (DOM), can be a valuable tool for swing traders by providing real-time insights into market activity at various price levels. Although swing trading focuses on holding positions for several days to weeks to capitalize on broader market trends, using a price ladder can help swing traders refine their entries and exits, assess market sentiment, and identify key support and resistance levels. Here’s how the price ladder relates to swing trading:
1. Identifying Key Support and Resistance Levels
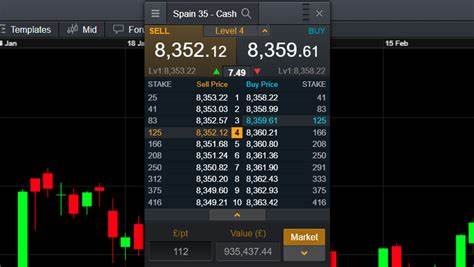
One of the core principles of swing trading is entering trades at pivotal points, such as support or resistance levels, where the price is likely to reverse or make a strong move. The price ladder shows the exact number of buy and sell orders placed at various price levels, helping swing traders see where major support (buy orders) or resistance (sell orders) exists.
For example, if a stock is approaching a support level on a technical chart and the price ladder shows a high volume of buy orders at that level, it may confirm the strength of that support. Swing traders can use this information to confidently enter a trade, anticipating a price bounce from support or a breakout from resistance.
2. Improving Entry and Exit Timing
Although swing traders aim to profit from medium-term price movements, entering a trade at an optimal price level is still crucial for maximizing profits. The price ladder can help swing traders fine-tune their entries by showing real-time liquidity and order flow. If a stock is trading near a swing trader’s target entry price, the price ladder reveals how much demand or supply is present at specific prices, helping them get a better fill on their trade.
For instance, if a trader sees that there are few sell orders near their intended buying price but a high volume of buy orders just below it, they might adjust their entry to a lower price, maximizing potential profits.
3. Assessing Market Sentiment
The price ladder is a direct reflection of market sentiment and can indicate the strength or weakness of a stock’s price movement. Swing traders often use technical analysis to predict price trends, but combining this analysis with the price ladder provides an additional layer of insight. For example, if a swing trader is anticipating a breakout based on technical patterns, the price ladder can confirm whether there is enough buying interest to push the price through resistance levels.
Conversely, if the price ladder shows a large number of sell orders just above the current price, it could indicate that resistance is stronger than anticipated, leading the trader to either wait for a confirmed breakout or avoid entering the trade altogether.
4. Tracking Institutional Activity
Institutional investors often place large orders, which can significantly impact price movement over time. The price ladder makes it easier for swing traders to spot these large buy or sell orders and adjust their strategy accordingly. If a swing trader identifies a substantial cluster of buy orders on the price ladder, it could signal that an institution is accumulating shares, potentially supporting the trader’s decision to go long.
On the flip side, if there are large sell orders placed at multiple price levels above the current price, it could indicate that institutions are looking to exit, signaling potential downward pressure.
5. Avoiding Slippage and Poor Liquidity
Slippage, which occurs when a trade is executed at a different price than expected due to market conditions, is a common issue for swing traders, especially when trading in low-liquidity stocks. The price ladder helps swing traders gauge liquidity in real time by showing the number of orders at each price level. This visibility helps them avoid entering trades during periods of low liquidity, reducing the risk of slippage and ensuring their orders are executed closer to their intended price.
Conclusion
The price ladder offers swing traders a real-time, detailed look at market activity that complements traditional technical analysis. By using the price ladder, swing traders can fine-tune their entries and exits, confirm support and resistance levels, assess market sentiment, and track institutional orders. These insights help traders improve their timing and decision-making, ultimately maximizing profits in swing trading.
