
Understanding Price Ladder and Order Flow in Stock Trading
The price ladder and order flow are powerful tools that day traders and investors can use to make more informed decisions when buying and selling stocks. These tools provide granular insights into market dynamics by displaying real-time data on orders placed in the market, giving traders a better understanding of supply and demand at various price levels. Utilizing price ladders and order flow helps traders assess market sentiment and make strategic moves to capitalize on short-term fluctuations.
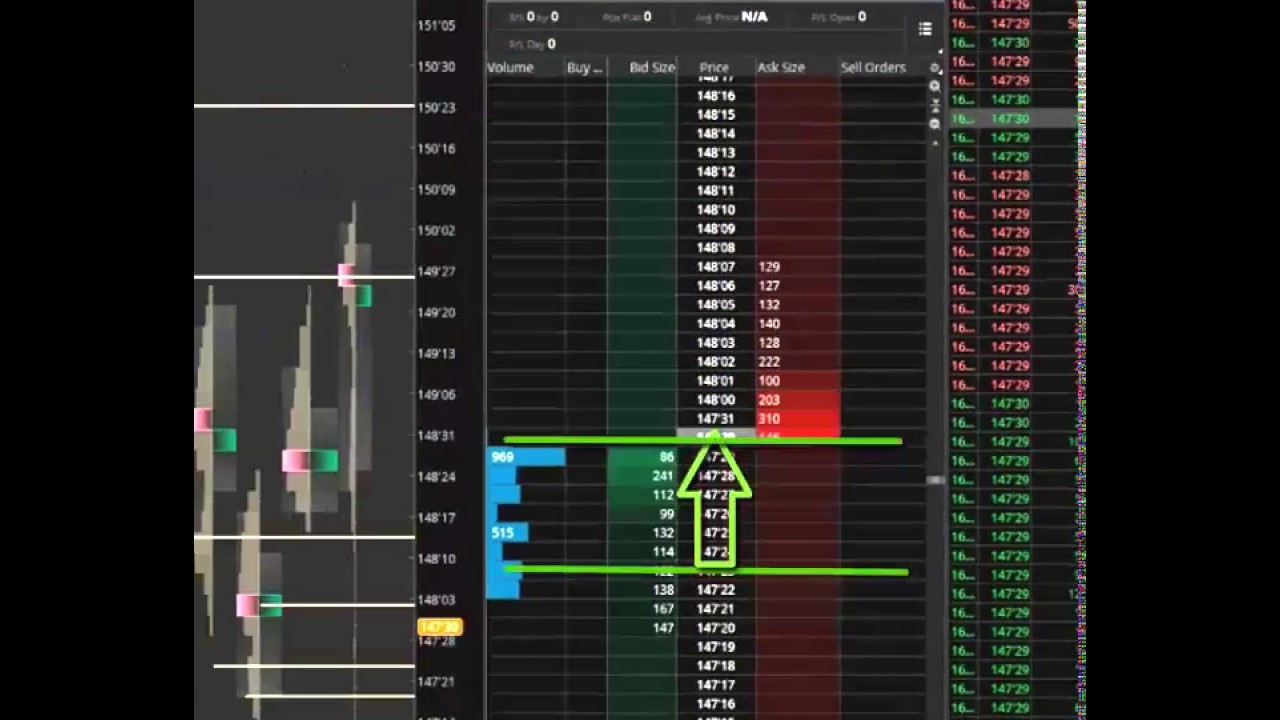
A price ladder, sometimes referred to as the depth of market (DOM), shows the bid and ask prices for a stock, along with the number of shares available at each price level. The price ladder allows traders to see how much buying or selling interest exists at various prices. For example, if a stock is trading at $50, the price ladder will show how many shares are being bid at lower prices, such as $49.95 or $49.90, and how many shares are being offered for sale at higher prices, like $50.05 or $50.10. This visibility helps traders identify levels of support and resistance, which are critical in determining potential price movements.
Order flow refers to the real-time movement of buy and sell orders as they are executed. Order flow data allows traders to track the volume and timing of transactions, providing a window into market activity. By analyzing order flow, traders can detect when large institutional investors, known as “whales,” are entering or exiting positions. This information is crucial for identifying momentum shifts or predicting price reversals. For example, if a trader sees a large number of buy orders coming in at a certain price, they may infer that the stock is about to rise and decide to take a long position.
How Day Traders and Investors Can Use Price Ladder and Order Flow
Day and Swing traders frequently use price ladders and order flow to time their entries and exits with precision. The real-time data available through these tools gives them a tactical advantage in volatile markets where prices can change rapidly. By monitoring the price ladder, day traders can identify potential breakout points or areas where large orders may cause price fluctuations. For instance, if a trader sees that there are significantly more buy orders at a particular level than sell orders, they might place a buy order in anticipation of upward momentum.
Order flow also allows day traders to employ strategies such as scalping, where they take advantage of small price movements by placing quick trades. By observing the volume and pace of transactions, scalpers can detect short-term trends and react faster than traders relying solely on price charts. Additionally, understanding order flow helps traders avoid “spoofing” tactics—where large fake orders are placed to manipulate the market—by verifying whether these orders are getting executed or just placed to deceive.
Longer-term investors can also benefit from analyzing price ladders and order flow, though their approach is different from day traders. Investors can use these tools to identify optimal entry or exit points for larger positions. For instance, an investor looking to accumulate a significant number of shares might use the price ladder to find areas with low resistance, where they can execute their trades without significantly moving the stock price. Likewise, analyzing order flow can help long-term investors confirm that their trades align with broader market sentiment and avoid entering positions at inopportune times, such as during heavy selling by institutions.
Conclusion
The combination of price ladders and order flow gives both day traders and long-term investors a deeper understanding of market behavior. By using these tools, traders can assess market sentiment, identify key price levels, and strategically time their trades to maximize profits or minimize risk. Whether you’re a fast-paced day trader reacting to minute-by-minute data or an investor planning a larger move, understanding how price ladders and order flow operate can provide a critical edge in today’s highly dynamic stock markets.
