
By ATGL
Updated July 29, 2025
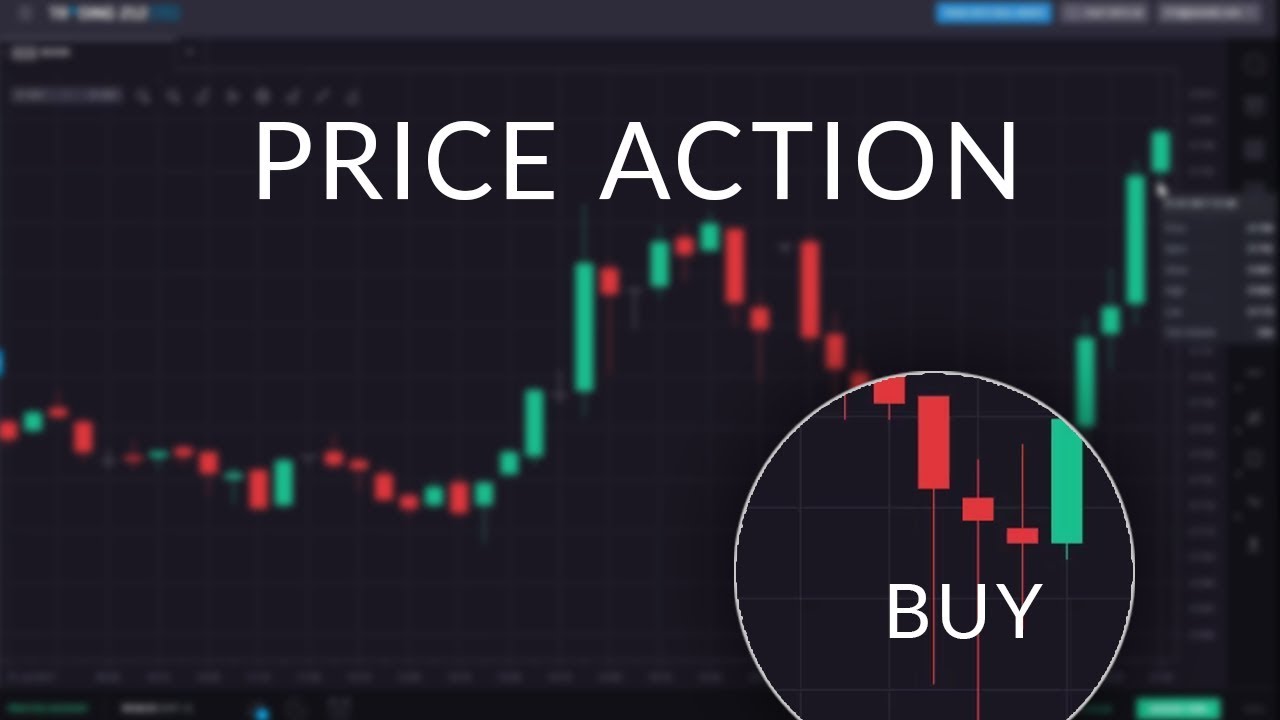
At its core, price action trading focuses solely on the movement of price, eliminating all secondary indicators. It removes distractions such as oscillators and moving averages, instead prioritizing raw price movement, candlestick formations, and market structure. For you’re looking to sharpen your execution and improve market timing, this approach offers clarity and control.
This article outlines how price action trading works, highlights high-probability price patterns, and explains how traders can interpret market sentiment without relying on traditional indicators. These insights apply across markets — whether you’re trading stocks, forex, crypto, or futures.
What Price Action Trading Is and How It Works
Price action trading is the study of historical price movements to anticipate future behavior. Unlike indicator-based systems, it doesn’t require lagging tools. Instead, price action traders evaluate market structure, supply and demand, candlestick formations, and trendlines.
The core idea is simple: All available information — economic data, news, sentiment — is already reflected in the current price. A skilled trader can analyze this price behavior to make informed decisions.
Can You Trade Just on Price Action?
Yes. Many experienced traders operate exclusively on price action. By learning to read price movements in real time, they gain agility that indicator-heavy systems often lack. This flexibility makes price action suitable for both short-term trading and longer-term investment strategies. However, it requires a solid understanding of chart behavior and a disciplined approach to avoid overtrading or misinterpretation.
The Essential Price Action Patterns Traders Can’t Ignore
Recognizing price action patterns is foundational to building a reliable trading strategy. While there are many, four consistently prove effective across different timeframes and asset classes:
- Pin Bar: A candle with a long wick and a small body. A bullish pin bar at support suggests rejection of lower prices, while a bearish pin bar at resistance indicates selling pressure.
- Engulfing Candle: Occurs when a larger candle fully engulfs the prior candle’s body. A bullish engulfing pattern at a key support zone signals strong buying interest.
- Inside Bar: A smaller candle that forms entirely within the range of the previous candle. Often a precursor to breakout moves.
- Doji: A candle with little or no body, reflecting indecision. When combined with a trendline or support/resistance, it can signal a reversal.
What Is an Example of a Price Action Trade?
Suppose a stock tests a well-defined support level and prints a bullish engulfing candle. A price action trader might place a buy order just above the high of that candle, using the low of the same candle as a stop-loss level. The trade anticipates a bounce based on prior support and strong buyer intent.
To improve trade entries, many traders incorporate candlestick patterns that confirm reversals or continuations.
How To Use Support and Resistance in Price Action Trading
Support and resistance levels serve as the backbone of price action analysis. Support is a level where demand absorbs selling pressure, while resistance is where supply overcomes demand. Traders use these zones to anticipate where price may pause or reverse.
Well-defined zones often coincide with prior swing highs or lows, round numbers, and high-volume areas. When combined with price action signals, they create high-probability trade setups.
Explore how these zones enhance technical analysis by revisiting our framework for support and resistance levels.
Spotting False Breakouts
A common trap in price action trading is the false breakout. This occurs when price briefly breaches a key level but then reverses sharply. Novice traders often enter prematurely, only to be stopped out.
To reduce the risk of false breakouts, wait for the price to close clearly above or below the key level, rather than just briefly moving past it. Strong breakouts are often backed by higher trading volume, which signals real interest from buyers or sellers. It also helps to watch whether the price comes back to test the same level again. If it holds at that level and starts to move in the breakout direction, it’s a stronger sign that the move is likely to continue.
However, if a stock breaks above resistance but fails to hold that level on the next candle, this could be a false signal. Recognizing this early helps reduce losses and improve timing.
Why Trendlines and Channels Matter in Price Action Trading
Trendlines help visualize the market’s directional bias. Drawing a trendline across higher lows (in an uptrend) or lower highs (in a downtrend) reveals the market’s path and likely reaction zones.
Channels are created by drawing two parallel lines that follow the general highs and lows of a price trend. When the price reaches the top of the channel during an uptrend, it may signal that the upward move is slowing down. If the price falls to the bottom of the channel, it can indicate a possible area where buyers might step in.
Trading Breakouts vs. Bounces
There are two core strategies here:
- Breakouts: Entering as price moves outside a trendline or channel. These require confirmation — strong volume, momentum, and a decisive close beyond the boundary.
- Bounces: Buying or selling as price touches the trendline and reacts. These setups offer favorable risk-reward and are often more reliable in range-bound markets.
The choice depends on market context. For instance, during periods of high volatility, breakout trades offer greater potential. When the market is calm, trading bounces let you place stop-loss orders closer to your entry point.
Price Action Strategies to Trade Breakouts and Reversals
Effective price action traders identify three key market conditions: breakouts, reversals, and continuations.
- Breakout Strategy: Wait for consolidation near a resistance level. Once price breaks above and holds, enter with a stop just below the breakout point. Confirm with volume expansion or a bullish candlestick close.
- Reversal Strategy: Look for double tops, head and shoulders, or trendline breaks supported by reversal candlesticks like pin bars or engulfing patterns. This aligns with analysis of patterns, such as the death cross in stocks.
- Continuation Strategy: Identify brief consolidations within a larger trend. Patterns like the bull flag pattern signal momentum continuation. Enter when price breaks out of the flag with strong conviction.
Each of these approaches fits within a broader price action strategy that prioritizes structure, risk control, and simplicity.
Trading Success Starts Here: Mastering Price Action
A consistent approach to identifying trends in stocks can improve trade selection and reduce exposure to countertrend setups. Price action trading helps you read the market in real time, without lagging indicators. It enhances clarity, improves trade timing, and strengthens your ability to assess sentiment.
At Above the Green Line, we remove emotions from investment decisions by using models grounded in technical tools, such as moving averages and relative strength. Whether your approach is systematic or discretionary, incorporating price action can enhance your investment strategies. Our membership plans provide access to institutional-quality setups, including curated stock opportunities, annotated charts, and expert insights to support more informed decisions and consistent performance across all market conditions.

Related Articles

Volatility Clustering in Financial Markets: Understand Why It Happens

Chaikin Money Flow (CMF): How to Use Volume to Spot Real Market Strength

What Is the Bid Ask Spread? How It Impacts Every Trade You Place
Intermarket Analysis: How to Use Cross-Asset Signals to Read the Market

[…] treat it as a standalone signal often get inconsistent results. Those who integrate it into broader price action trading tend to see much more consistency over […]