
By ATGL
Updated July 31, 2025
Technical analysis provides you with systematic methods for evaluating market movements through price action and chart formations. Reliable chart patterns serve as fundamental tools for swing traders and position traders who want to capitalize on market reversals and trend changes. Among the various bearish reversal signals, the Pipe Top Pattern stands out as a particularly potent indicator, yet many beginners overlook its significance.
This comprehensive guide examines the Pipe Top Pattern in detail, covering identification techniques, optimal entry and exit points, risk management protocols, and methods for distinguishing genuine signals from false breakouts. Understanding this pattern enhances your ability to spot potential market tops and position yourself advantageously during bearish reversals.
What Is the Pipe Top Pattern?
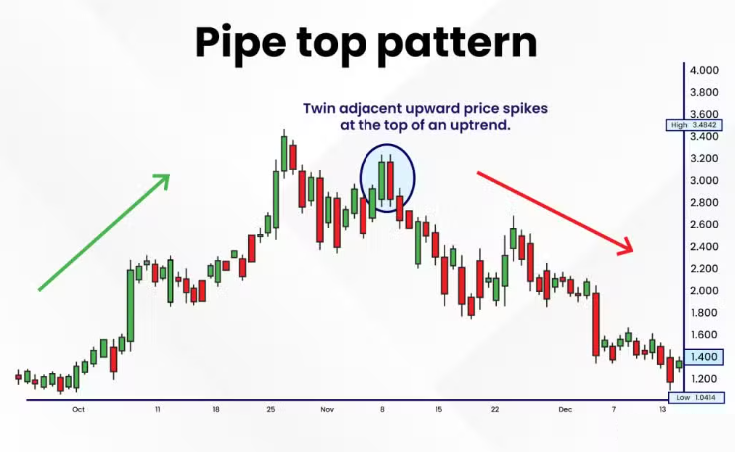
The Pipe Top Pattern represents a bearish reversal formation that appears on candlestick charts, signaling a potential shift from bullish to bearish momentum. This pipe top chart pattern consists of four distinct candles: two consecutive strong bullish candles followed by two consecutive strong bearish candles. The formation resembles a pipe or chimney when viewed on a chart, hence its descriptive name.
Traders recognize this pattern as a bearish reversal indicator because it demonstrates a clear rejection of higher prices after an initial surge. The pattern typically occurs near resistance levels or after extended upward movements, suggesting that buying pressure has been exhausted and selling pressure is beginning to dominate the market.
The pipe top and bottom pattern (with the bottom version being its bullish counterpart) represents one of the most reliable reversal signals when properly identified and confirmed. The symmetrical nature of strong moves in opposite directions creates a distinct visual signature that experienced traders quickly recognize on their charts.
How the Pipe Top Chart Pattern Forms
Market psychology drives the formation of the Pipe Top Pattern through a specific sequence of emotional responses among traders and investors. Initially, strong bullish sentiment propels prices higher through two consecutive strong green candles. This upward movement often occurs due to positive news, earnings beats, or technical breakouts that attract momentum buyers.
The first two bullish candles reflect optimism and aggressive buying pressure. Market participants interpret the strong upward movement as confirmation of continued bullish trends, leading to increased position sizes and new long entries. However, this enthusiasm proves short-lived as the market encounters resistance or profit-taking pressures.
The subsequent two bearish candles represent a sharp reversal in sentiment. Sellers emerge to take profits or establish short positions, creating significant downward pressure. This selling activity often occurs as you recognize that the initial bullish surge has failed to sustain itself, prompting a reassessment of market conditions. The rapid transition from bullish to bearish sentiment creates the characteristic pipe-like formation on the chart.
Key Criteria for Confirming a Pipe Top Pattern
Pattern confirmation requires specific criteria to distinguish legitimate Pipe Top formations from random price fluctuations. The first requirement involves the size and strength of the initial two bullish candles. These candles should display substantial body sizes with minimal upper shadows, indicating strong buying pressure without significant rejection.
The subsequent two bearish candles must demonstrate equal or greater strength than the preceding bullish candles. Large red bodies with minimal lower shadows provide evidence of sustained selling pressure. The bearish candles should ideally close below the opening price of the first bullish candle, confirming that sellers have reversed the entire bullish movement.
Volume analysis provides additional confirmation for the pattern. High volume during the formation of all four candles suggests genuine market participation rather than low-volume noise. Particularly important is increased volume during the bearish candles, which validates the selling pressure and strengthens the reversal signal.
Context within the broader market trend also influences pattern reliability. Pipe Top patterns carry greater significance when they appear after extended upward movements or near established resistance levels. The pattern’s effectiveness diminishes in sideways or already declining markets where bearish pressure may represent continuation rather than reversal.
When To Enter and Exit Trades Using the Pipe Top Pattern
Successful trading of the Pipe Top Pattern requires precise timing for entries and exits. Pattern confirmation occurs only after the completion of the fourth candle, specifically when the second bearish candle closes. Premature entries before pattern completion increase the risk of false signals and whipsaws.
Entry Strategies After Pattern Confirmation
Conservative traders wait for additional confirmation beyond the basic four-candle formation. A break below the low of the second bearish candle provides this extra validation, indicating that selling pressure continues to dominate. This approach reduces false signals but may result in slightly less favorable entry prices.
Aggressive traders enter short positions immediately after the second bearish candle closes below the opening price of the first bullish candle. This strategy capitalizes on earlier entries but carries a higher risk of reversal if the pattern fails to follow through.
Position sizing plays a vital role in managing risk during pattern-based trades. Calculate position sizes based on the distance between your entry point and stop-loss level, limiting risk to a predetermined percentage of your trading capital. This disciplined approach helps preserve capital during inevitable losing trades.
Setting Stop-Loss and Take-Profit Levels
Stop-loss placement for Pipe Top Pattern trades typically occurs above the high of the second bullish candle. This level represents a logical exit point because a break above this high invalidates the bearish reversal thesis and suggests the original bullish momentum may resume.
Take-profit targets depend on individual trading strategy preferences and market conditions. Conservative traders target the next significant support level or use a 1:2 risk-reward ratio. More aggressive traders may hold positions longer, targeting major support levels or using trailing stops to capture extended moves.
Avoiding Common Mistakes and False Signals
You may encounter several common errors while attempting to trade the Pipe Top Pattern. The most frequent mistake involves entering trades before complete pattern formation. Incomplete patterns lack the confirmation necessary for high-probability trades and often result in premature reversals.
Another significant error involves ignoring market context when evaluating patterns. Pipe Top formations in strong uptrends may represent temporary pullbacks rather than major reversals. Always consider the broader trend and overall market sentiment when assessing pattern significance.
False signals often occur in low-volume environments or during market holidays when reduced participation creates artificial price movements. Filter out these questionable setups by requiring above-average volume during pattern formation and avoiding trades during thin market conditions.
Confirmation bias represents another trap for pattern traders. Avoid forcing patterns onto charts where they don’t clearly exist. Genuine Pipe Top patterns display obvious characteristics that require no imagination or creative interpretation to identify.
How This Pattern Fits Into a Broader Trading Strategy
The Pipe Top Pattern works most effectively when integrated into comprehensive investment strategies rather than used in isolation. Combine pattern analysis with technical indicators such as moving averages, RSI, and MACD to strengthen signal reliability and reduce false signals.
Multiple timeframe analysis enhances pattern effectiveness by providing context for trade decisions. A Pipe Top Pattern on a daily chart carries more significance when supported by bearish signals on weekly charts, while patterns on shorter timeframes benefit from confirmation on higher timeframes.
Successful traders incorporate the Pipe Top Pattern into their arsenal of day trading patterns, using it alongside other reversal signals such as double tops, head and shoulders formations, and engulfing patterns. This diversified approach provides multiple opportunities for profitable trades while reducing dependence on any single pattern type.
Start Spotting Pipe Tops With More Confidence
Above the Green Line offers comprehensive resources and expert guidance to help you identify high-probability trading opportunities. Visit our membership page to discover how our proven strategies can elevate your trading performance and help you spot profitable patterns with greater consistency.

Related Articles

Margin Call Explained: What Triggers It and How to Avoid One

AMC Short Squeeze Explained: Timeline, Causes, and Trading Risks

Volatility Clustering in Financial Markets: Understand Why It Happens

Chaikin Money Flow (CMF): How to Use Volume to Spot Real Market Strength
