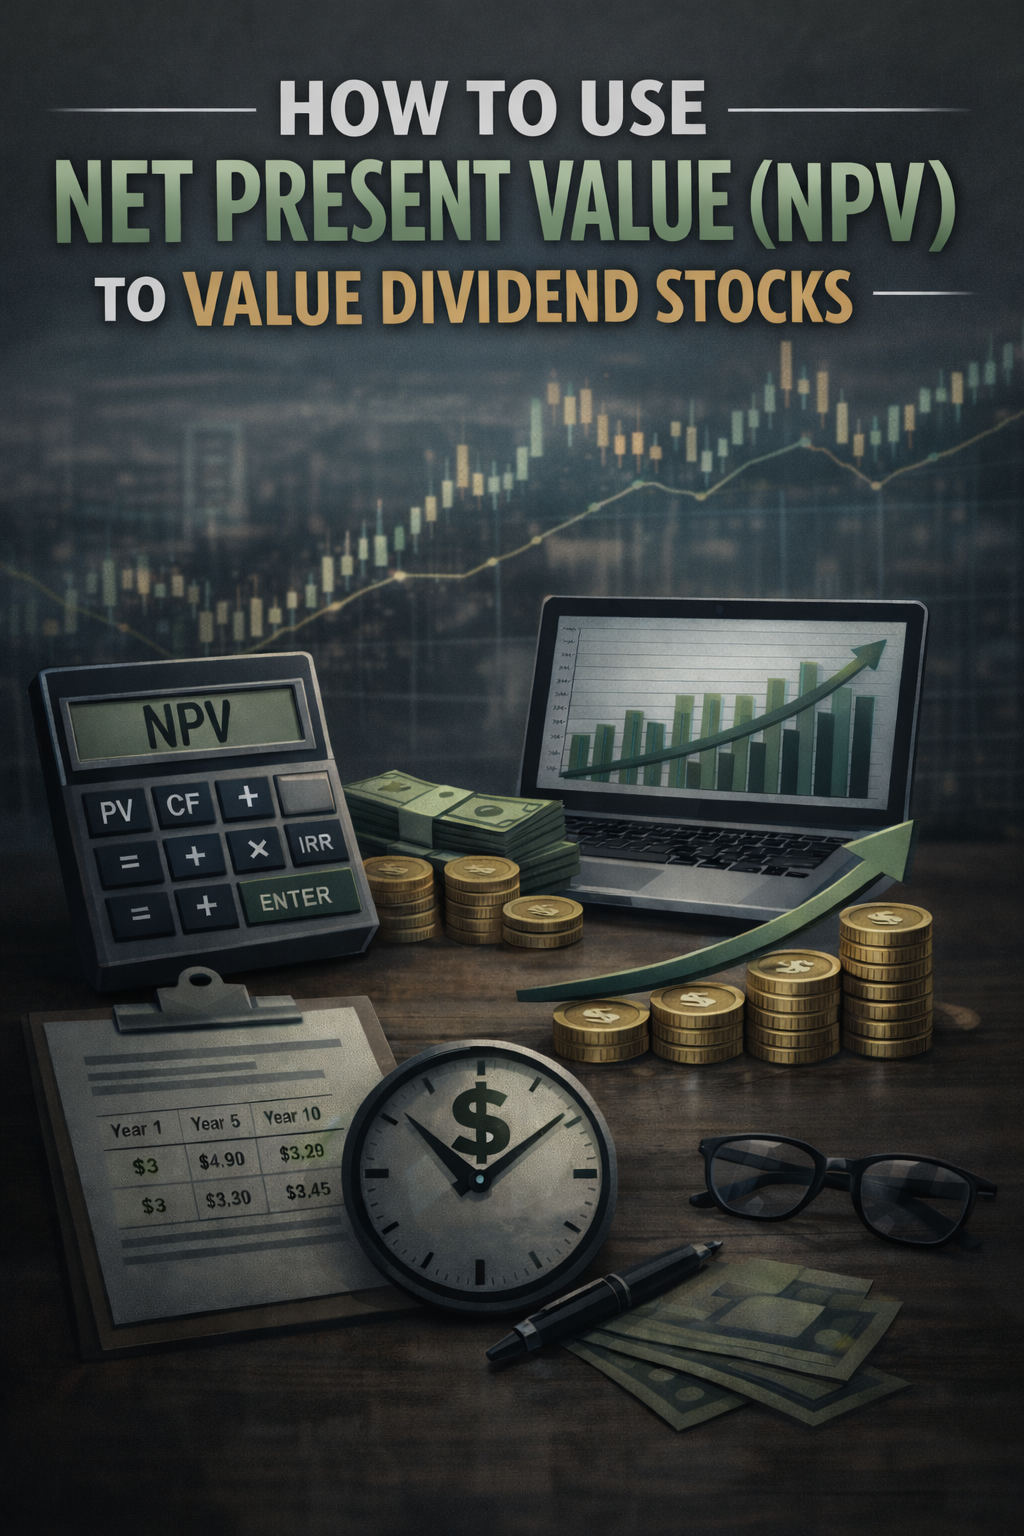
By Andrew Stowers
Updated February 27, 2026
Dividend investors often focus on yield, payout ratios, and dividend growth streaks. Those metrics matter. But they don’t answer the most important question: is the stock priced appropriately for the cash flow it will generate in the future?
That’s where net present value (NPV) becomes powerful. While NPV is frequently discussed in capital budgeting or corporate finance textbooks, it applies just as directly to dividend investing. At its core, NPV helps you determine whether the future stream of dividends you expect to receive is worth more or less than the price you are paying today.
Understanding this framework shifts investing from income collection to disciplined valuation. Instead of asking, “What does this stock yield?” you begin asking, “Are these future dividends worth what I’m paying right now?” That change in thinking can meaningfully improve long-term results.
What Is Net Present Value (NPV)?
Net present value is a financial metric that measures the difference between the present value of future cash inflows and the initial investment required to generate those inflows. It accounts for the time value of money by discounting future cash flows back to today using a required rate of return.
In simple terms, NPV tells you whether the dollars you expect to receive later are worth more or less than the dollars you invest now. If the present value of expected future cash flows exceeds the purchase price, the NPV is positive. If it falls short, the NPV is negative.
A positive NPV suggests that, based on your assumptions, the investment is expected to generate returns above your required rate. A negative NPV suggests the investment may not meet your return threshold. This straightforward decision rule makes NPV one of the most widely used valuation tools in finance.
The Time Value of Money Explained
The foundation of NPV is the time value of money. Money available today can be invested and earn returns. Because of that opportunity cost, a dollar received in five years is worth less than a dollar received now. Discounting adjusts future cash flows to reflect this difference in value.
For dividend investors, this principle matters. A dividend payment ten years from now does not carry the same value as a dividend paid next quarter. Inflation, reinvestment opportunities, and risk all influence how much future income is truly worth today. NPV incorporates these factors into a single structured framework.
The NPV Decision Rule
The decision rule is simple and practical. If NPV is greater than zero, the projected cash flows exceed your required return, making the investment financially attractive under your assumptions. If NPV is less than zero, the expected cash flows do not justify the current price.
This rule is used in capital budgeting, real estate analysis, and business valuation. When applied to dividend stocks, it provides a disciplined way to determine whether you are paying too much for a stream of future income.
How to Calculate NPV Step by Step
Calculating NPV involves estimating future cash flows, selecting a discount rate, and summing the present value of those cash flows before subtracting the initial investment. Although the formula may appear technical, the logic is straightforward.
Breaking Down the Formula
The standard formula is:
NPV = Σ [ CFₜ ÷ (1 + r)ᵗ ] − Initial Investment
In this equation, CFₜ represents the cash flow in each future year, r is the required rate of return, and t is the time period. For dividend stocks, CFₜ represents projected dividend payments. The initial investment is the current stock price.
The required rate of return reflects your opportunity cost and risk tolerance. It is the return you demand to justify owning the stock instead of placing capital elsewhere.
Dividend Stock Example
Consider a stock trading at $70 that currently pays a $3 annual dividend. Suppose you expect the dividend to grow at 5% per year and require an 8% annual return.
First, you project each year’s dividend over your chosen time horizon. Then you discount each projected payment back to present value using the 8% rate. If the total present value of those dividends equals $75, the NPV is $5. That positive value indicates the stock may be attractively priced relative to your return expectations.
This structured approach forces you to evaluate both growth and risk, rather than relying solely on headline yield.
Applying NPV in Real-World Dividend Analysis
Where NPV becomes especially useful is when comparing competing opportunities.
Case Study: High Yield vs High Growth
Consider two stocks:
Stock A yields 6% but grows dividends at 1%.
Stock B yields 3% but grows dividends at 9%.
At first glance, Stock A appears more attractive because of its higher income. But when discounted over ten to fifteen years, Stock B’s accelerating dividend growth may produce a higher NPV.
The math often reveals that steady growth compounds more powerfully than static yield. Without NPV, this difference can be difficult to quantify.
Sensitivity to Discount Rate Changes
NPV is also sensitive to your required return. Suppose your base case assumes an 8% discount rate. If market interest rates rise and you demand 10% instead, the present value of future dividends declines.
This sensitivity analysis is critical. It shows how changes in risk perception or opportunity cost affect valuation. Running multiple scenarios—8%, 9%, 10%—provides a range rather than a single fixed answer.
Professional analysts rarely rely on a single discount rate. They evaluate how valuation shifts under different assumptions.
Using NPV to Evaluate Dividend Stocks
For investors focused on dividend growth investing, NPV offers clarity. Instead of simply screening for high yields or long dividend histories, you evaluate whether the projected dividend stream justifies today’s price.
Choosing the Right Discount Rate
Selecting the discount rate is one of the most important decisions in the calculation. Many investors use a required return between 8% and 10%, though the appropriate rate depends on individual goals and risk tolerance. Stable, established companies may justify lower required returns, while cyclical or higher-risk firms may demand higher rates.
Consistency is critical. Changing your discount rate to make a valuation work undermines the discipline NPV is designed to provide.
NPV vs Dividend Yield
Dividend yield is backward-looking. It reflects the current dividend divided by price. NPV, however, incorporates growth expectations and the time value of money.
A stock with a 6% yield but minimal growth may generate lower NPV than a stock yielding 3% with steady annual increases. Investors who focus exclusively on yield may overlook companies that create greater long-term value through compounding.
By integrating NPV into a broader dividend investing strategy, you evaluate investments based on total expected value rather than immediate income alone.
NPV Compared to Other Valuation Methods
NPV works alongside other valuation tools commonly used in dividend analysis.
NPV vs Dividend Discount Model
The dividend discount model estimates intrinsic value by assuming dividends grow at a constant rate indefinitely. The gordon growth model is the most common version of this approach.
While DDM provides a streamlined calculation, it relies heavily on perpetual growth assumptions. NPV allows for more flexibility. You can model changing growth rates, finite holding periods, or conservative scenarios that better reflect real-world conditions.
Many investors use DDM for an initial estimate and NPV for deeper analysis.
NPV vs Internal Rate of Return
Another related concept is the internal rate of return. Discussions often compare internal rate of return vs net present value because both evaluate investment profitability.
IRR calculates the annualized return implied by projected cash flows. NPV determines whether those cash flows exceed your required return. When analyzing dividend stocks, NPV is particularly useful for assessing whether the current price aligns with your expectations.
Assumptions, Risks, and Practical Considerations
No valuation model is perfect. NPV depends entirely on assumptions about dividend growth, economic conditions, and required returns.
If growth slows unexpectedly or earnings decline, projected cash flows may not materialize. Overestimating the dividend growth rate can inflate calculated value and create a false sense of security.
Investors should use conservative assumptions and revisit calculations periodically. NPV is not a guarantee; it is a structured method for thinking about value.
Common Mistakes to Avoid
Common errors include projecting unrealistic long-term growth, using inconsistent discount rates across investments, and failing to adjust assumptions when company fundamentals change.
NPV works best when paired with qualitative analysis, including balance sheet strength, competitive positioning, and payout sustainability.
Applying NPV in a Long-Term Dividend Strategy
When integrated thoughtfully, net present value becomes more than a formula. It becomes a discipline.
It encourages investors to define required returns, estimate growth realistically, and compare investments on a consistent basis. Instead of reacting to short-term price swings, you evaluate whether intrinsic value supports current pricing.
Over time, this structured mindset can reduce emotional decision-making and improve capital allocation. Yield may attract attention, but value determines long-term outcomes.
Most investors never calculate NPV for dividend stocks. Those who do gain a clearer understanding of what they are actually buying: a stream of discounted future cash flows.
And that clarity is often what separates speculation from disciplined investing.
Bringing It All Together
Here’s the real takeaway.
NPV forces you to think like a business owner. You’re not buying a ticker symbol. You’re buying cash flows.
When you combine NPV analysis with tools like our top 100 candidates screening list, you filter dividend stocks by valuation — not just popularity. You can cross-reference expected payout dates using the dividend calendar. You can see how valuation plays out in real time by reviewing our current positions. You can continue to learn all about dividend growth investing through our Dividend Growth Guide.
And if you want structured guidance on applying this systematically — not emotionally — Join Above the Green Line. because investing isn’t about chasing what looks good. It’s about calculating what makes sense.

Related Articles
Dividend Growth Model ===>

Free Cash Flow: The Ultimate Guide to Financial Strength and Dividend Sustainability

Dividend Reinvestment Plan (DRIP): How Automatic Reinvestment Builds Long-Term Wealth
Dividend Growth vs High Yield: Choosing the Right Income Strategy for Long-Term Investors
Dividend Sustainability