Above the Green Line -01
  • Market Insights
        • Commentary
          • Daily
          • Weekly
        • BUY / SELL SIGNALS
          • Trade Posts
          • Recent Trade Alerts
          • Recent Day Trades
        • BLOGROLL
          • Dividend Growth Blog
          • ETF Sector Blog
          • Dow Dogs
          • TPOW Blog
  • Strategies
        • SWING TRADING
          • Current Positions
          • Watchlists
          • Closed Positions
          • Candidates - TOP 100
          • Specialty Stocks
        • WEEKLY STOCK PICK
          • TPOW Charts
          • TPOW Performance
          • TPOW Strategy Guide
          • TPOW Performance Dashboard
        • DAY TRADING
          • Watch List
        • ATGL DASHBOARD
        • ETF STRATEGIES
          • ETF Sector Rotation
          • ETF Sector Portfolio
        • DIVIDEND GROWTH
          • Dividend Growth Portfolio
          • Dividend Calendar
        • DOGS OF THE DOW
          • Dogs of the Dow Portfolio
          • DOW 5 Portfolio
  • Markets
        • US MARKET
          • Commodities
          • Energy
          • Precious Metals
          • Volatility
        • GLOBAL MARKETS
          • Market Indices
          • Economic Calendar
          • FOREX Heat Map
          • FOREX Cross Rates
          • Crypto Currency Market
  • Investing
    • Discord Community
    • Dashboard
  • Resources
        • ARTICLES
          • Dividend Growth Model Articles
          • ETF Articles
          • Investment Strategies Articles
          • Market and Economic Insights
          • Stock Trade Articles
          • Stock Reviews
        • TOOLS
          • Stock Scanners
          • Charting Software
          • Brokerage Firms
        • STOCK CHARTS
          • Key Components
          • Reading Charts
          • Drawing Stock Charts
          • Identifying Trends
        • RETIREMENT PLANNING
  • About
    • Contact Us
    • How to Win
    • #1 At Stockcharts
    • Disclaimer
    • FAQ
  • Log In
  • Subscribe

September 17, 2021

Money Wave Alert! Sep 17, 2021

XLK Chart
The Tech Stocks were down today but are above the Red Line.

Markets were lower today as there were few Buyers to be found. Some of the Leaders have gone slightly lower than on Tuesday, but most are still holding above the Red Lines (50-day avgs.) The decline has been very slow, which normally means that we should see a rally back up soon.

There have been several Money Wave Buy Signals this week, but most of them have popped up on weak Volume. We like to see Heavy Volume, to show strong Buying Conviction. 

New Investors:  The Leaders have bounced up out of the Green Zones for Money Wave Buy Signals, but the Buying is unusually weak. Normally we won’t see a big advance until the Volume picks up. The better trades happen when the S&P 500 Index is in the Green Zone (Like yesterday).  

Triple Buys today on CHS (+4%), OCGN (+5%), & DVAX (+3.5%). Soon for ANY BBIG GREE GSAT & GSM in DAY TRADING SETUPS. 

Bonds  were lower today, but are Above the Green Line.

Crude Oil was down $0.62 today at $71.99.

BUYS TODAY    9/17/2021   

DVAX      DYNAVAX TECH      Money Wave Buy today, but DVAX will not be Bought or Logged as the Volume is below average of 4.1 MIL.

We will “Not Log” trades if the Reward/Risk is not at least 2:1, or Low Volume. These have more risk.   

_________________________________________________________________________________________________

JUMP START SCROLLING CHARTS: (Buy Signal should be very soon… Click on the Jump Start link for more info.)     

BBIG      VINCO VENTURES INC.      Wait for Money Wave Close > 20 with High Volume.       

CHS      CHICOS FAS INC.     Buy above the Pink Line around $4.71 with High Volume with a 5% Trailing Sell Stop Loss below it.   

_________________________________________________________________________________________________

WATCH LIST (Click here)       

WATCH LIST SCROLLING CHARTS (Real Time)                 

BTU      PEABODY ENERGY      Wait for Money Wave Close > 20 with High Volume.   

GSM      FERROGLOBE PLC.      Wait for Money Wave Close > 20 with High Volume.     

HUT      HUT 8 MINING CORP.      Wait for Money Wave Close > 20 with High Volume.   

NEGG      NEWEGG COMMERCE INC.      Buy above $21.22 with High Volume with a 5% Trailing Sell Stop Loss below it.      

Please be patient and wait for Money Wave Buy Signals.  We will email you when they are ready. Follow on the WATCH LIST.      
Emotions are very high now, so please do not Buy unless you are VERY NIMBLE.

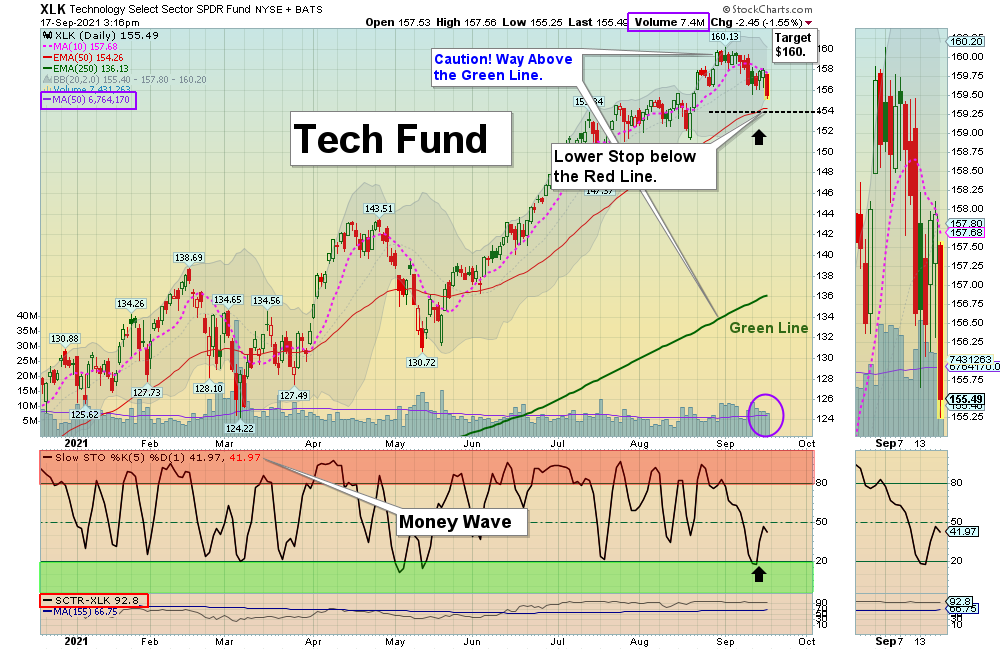
The Leaders are Way Above the Green Lines (all Investments eventually return to their Green Lines).      

____________________________________________________________________________________________________________

SELLS TODAY    

AA      ALCOA CORP.      EXIT if it is going to Close below the Pink Line around $48.26. The Target was already Hit.     

M      MACY’S INC.      EXIT if it is going to Close below your Buy Price, or $21.64.

MRNA      MODERNA INC.      EXIT if it is going to Close below the Pink Line around $432.30. The Target was already Hit for a 12.8 % Gain.     

NUE      NUCOR CORP.      EXIT if it is going to Close below Support of $105.82.  This trade was not logged.    

PXLW      PIXELWORKS INC.      EXIT if it is going to Close below your Buy Price, or $5.32. This trade was not logged.       

QQQ      NASDAQ 100 FUND      LOWER the Sell Stop Loss below the Red Line of $368.69. 

SPY      S&P 500 FUND      LOWER the Sell Stop Loss below the Red Line of $440.47.     

XLK      TECH FUND     LOWER the Sell Stop Loss below the Red Line of $154.26. 

Click for  CURRENT POSITION SCROLLING CHARTS – Real Time  (Please check and adjust your Sell Stops).     

Click for  CLOSED POSITIONS,   
NEW:       MY TRADING DASHBOARD
DAY TRADING SETUPS
NEW:  TRADE ALERTS
ARE YOUR INVESTMENTS ABOVE THE GREEN LINE?
ETF SECTOR ROTATION SYSTEM   
TOP 100 LIST Updated Sep 1, 2021

Many like to Buy the day before, near the Close, if the Money Wave is going to create a Buy Signal (Closing > 20 and out of the Green Zone).

Don’t Buy if the Investment has already popped up too much. Money Wave Buys are usually good for a 3-6 %  move in a few days.

We will “Not Log” trades if the Reward/Risk is not at least 2:1, or Low Volume. These have more risk.


HAVE A NICE WEEKEND!

Related Post

– Money Wave Alert! Sep 16, 2021

Subscribe to Our Newsletter

AGL Logo

Get our eBook Now!

Candlestick - A Swing Traders Friend

We don’t spam! Read our privacy policy for more info.

You’ve been successfully subscribed to our newsletter!

Voted #1 at Stock Charts

SH Chart
Inverse S&P 500 Fund (SH) will have a Money Wave Buy today.

Help Us Help Animals

Help Us Help Animals

Recent Comments

  • Market Breadth Indicators: A Trader’s Guide to Early Trend Detection on Backtesting: Definition and How a Trading Strategy Backtest Works
  • Island Reversal Pattern: Definition and Formation Explained on Double Top Pattern: How to Identify and Trade This Reversal Signal
  • Channel Pattern Guide: What It Is and Why It Matters on A Guide to Forecasting Using Moving Averages
  • What Is a Broadening Bottom Chart Pattern? Full Guide on Bull vs. Bear Market: An Investor’s Guide to Market Phases
  • ATGL Weekly Money Flow - 2025-05-11 on ATGL Top Pick of the Week! Apr 6, 2025

Become a Green Liner!

Help me make more Money in the Stock Market.

ON ATGL

  • DashBoard
  • Weekly Commentary
  • Daily Buy / Sell Signals
  • Day Trade Setup
  • Trading Rooms

Design & Develop By Pixelvect

STRATEGIES

  • Swing Trading
  • ATGL Pick of the Week
  • Dividend Growth
  • ETF Sector Rotation
  • Dogs of the Dow

HELP

  • ATGL Trading Rules
  • FAQ
  • Account Maintenance
  • Contact US
  • Join

FOLLOW US

Instagram Linkedin Twitter Facebook

© COPYRIGHT 2024 · ABOVETHEGREENLINE.COM · ALL RIGHTS RESERVED · PRIVACY · TERMS · CONTACT · WATCHLIST · CURRENT