Above the Green Line -01
  • Market Insights
        • Commentary
          • Daily
          • Weekly
        • BUY / SELL SIGNALS
          • Trade Posts
          • Recent Trade Alerts
          • Recent Day Trades
        • BLOGROLL
          • Dividend Growth Blog
          • ETF Sector Blog
          • Dow Dogs
          • TPOW Blog
  • Strategies
        • SWING TRADING
          • Current Positions
          • Watchlists
          • Closed Positions
          • Candidates - TOP 100
          • Specialty Stocks
        • WEEKLY STOCK PICK
          • TPOW Charts
          • TPOW Performance
          • TPOW Strategy Guide
          • TPOW Performance Dashboard
        • DAY TRADING
          • Watch List
        • ATGL DASHBOARD
        • ETF STRATEGIES
          • ETF Sector Rotation
          • ETF Sector Portfolio
        • DIVIDEND GROWTH
          • Dividend Growth Portfolio
          • Dividend Calendar
        • DOGS OF THE DOW
          • Dogs of the Dow Portfolio
          • DOW 5 Portfolio
  • Markets
        • US MARKET
          • Commodities
          • Energy
          • Precious Metals
          • Volatility
        • GLOBAL MARKETS
          • Market Indices
          • Economic Calendar
          • FOREX Heat Map
          • FOREX Cross Rates
          • Crypto Currency Market
  • Investing
    • Discord Community
    • Dashboard
  • Resources
        • ARTICLES
          • Dividend Growth Model Articles
          • ETF Articles
          • Investment Strategies Articles
          • Market and Economic Insights
          • Stock Trade Articles
          • Stock Reviews
        • TOOLS
          • Stock Scanners
          • Charting Software
          • Brokerage Firms
        • STOCK CHARTS
          • Key Components
          • Reading Charts
          • Drawing Stock Charts
          • Identifying Trends
        • RETIREMENT PLANNING
  • About
    • Contact Us
    • How to Win
    • #1 At Stockcharts
    • Disclaimer
    • FAQ
  • Log In
  • Subscribe

October 4, 2022

Money Wave Alert! Oct 4, 2022

SPX Chart
It’s been a nice 2 day bounce up off of Support for the S&P 500 Index.

Markets were sharply higher today as the buying continued and the Sellers were gone. The Indices were stretched down Way Below the Green Lines on FEAR. Now the Indices gapped up above the Pink Lines (10-day avgs.) forcing the Short Sellers to cover (Buy back their stock).

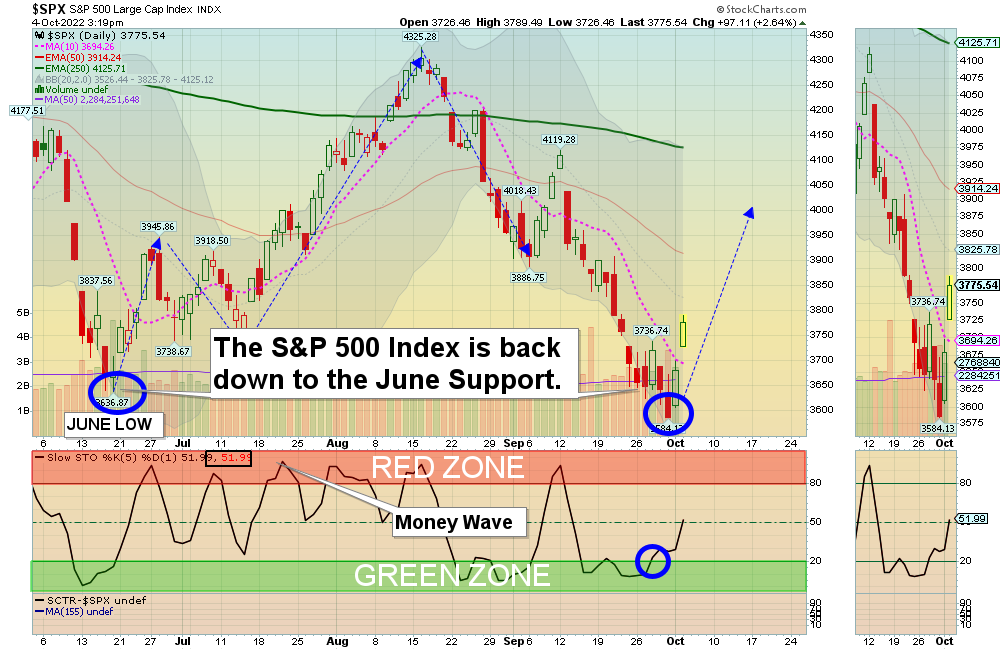
Some are betting that the S&P 500 is doing a “W” pattern by bouncing up off of the June Support. But we need the US Dollar and long Term Interest Rates to correct back down towards the Green Lines. These have been keeping Stocks from bottoming. 

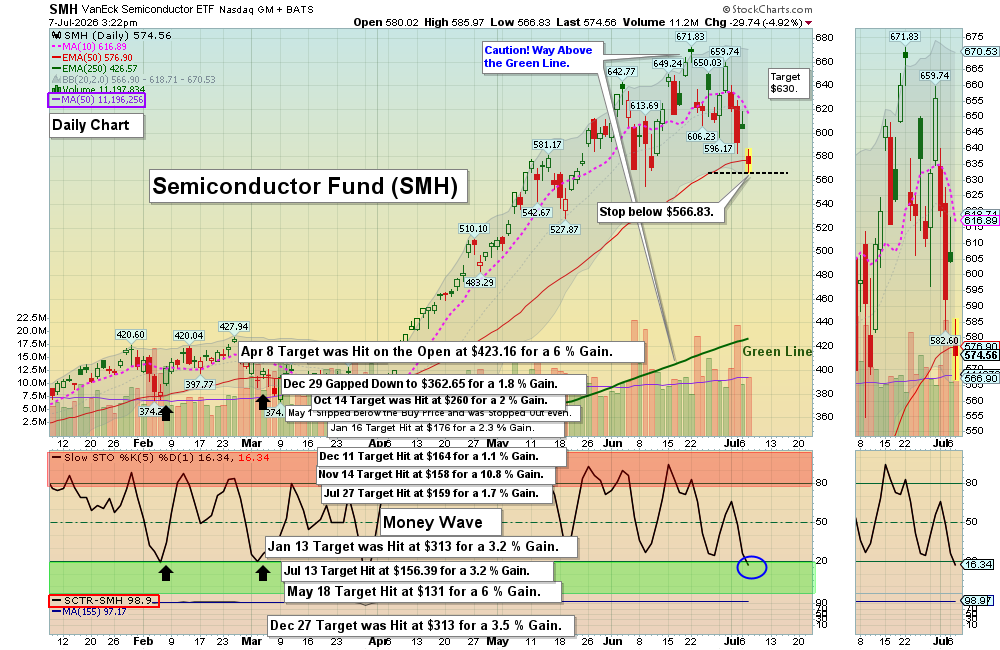
Please be patient and wait for Buy Signals for Securities that are still Above the Green Lines.  BUYS SOON – CHARTS  The best moves are when the S&P 500 Index is also coming up out of the Green Zone.  

_________________________________________________________________________________________________________________

BUYS TODAY   10/4/02022     NONE TODAY


BUYS TOMORROW 

NAT      NORDIC AMER. TANKER      Wait for Money Wave Close > 20 with High Volume.

TCRT      ALAUNOS THERA.      Wait for Money Wave Close > 20 with High Volume.

Shop for a better price earlier in the day with Triple Buy Signal, on the same day that a Daily Money Wave Buy Signal will occur.  

We will “Not Log” trades if the Reward/Risk is not at least 2:1, or Low Volume. These have more risk.   

BUYS SOON     

DHT      DHT HOLDINGS      Wait for Money Wave Close > 20 with High Volume.     

HRB      H&R BLOCK      Wait for Money Wave Close > 20 with High Volume. 

SAVA      CASSAVA SCIENCES      Money Wave must Close in the Green Zone.

SIGA      SIGA TECH.      Buy above $11.25 with High Volume with a 5% trailing Sell Stop Loss below it.     

UUP      US DOLLAR FUND      Wait for Money Wave Close > 20 with High Volume. 

Please be patient and Wait for Money Wave Buy Signals.  We will email you when they are ready. Follow on the WATCH LIST.   

SELLS TODAY            

PBR      PETROBRAS ENERGY    EXIT below your Buy Price or $13.52. Don’t Take a Loss! Get out even.   

SARK      INVERSE ARK INNONAVTION FUND     EXIT if it is going to Close below the Pink Line around $60.69. The Target was already Hit at $60 for a 12.9 % Gain.

__________________________________________________________________________________________________________

DAY TRADING SETUPS.  Several Triple Buy Pops today: AMC (+16%) MARA (+16%) SOXL (+13%) TQQQ (+8%) TARK (+14%) & UDOW (+8%). ( Try out the New Side by Side layout.      

DAY TRADING FOR INDICES & LARGE CAPS CHARTS.

Bonds were up today but are Way Below the Green Line.  

Crude Oil was up $2.60 today at $86.23.

MY TRADING DASHBOARD 
SWING TRADING CURRENT POSITIONS
DAY TRADING SETUPS
TRADE ALERTS
GREEN LINE CHARTS AT STOCKCHARTS
ARE YOUR INVESTMENTS ABOVE THE GREEN LINE?
GREEN LINE RULES
ETF SECTOR ROTATION SYSTEM   
New TOP 100 LIST Updated Oct 1, 2022

Many like to Buy the Swing Trades just before the Close, if the Money Wave is going to create a Buy Signal (Closing > 20 and up out of the Green Zone). Don’t Buy if the Security has already popped up too much. Money Wave Buy Signals are usually good for a 3-6 % move in a few days.

We will “Not Log” trades if the Reward/Risk is not at least 2:1, or Low Volume. These have more risk.   

Related Post

– NAT

Subscribe to Our Newsletter

AGL Logo

Get our eBook Now!

Candlestick - A Swing Traders Friend

We don’t spam! Read our privacy policy for more info.

You’ve been successfully subscribed to our newsletter!

Voted #1 at Stock Charts

SH Chart
Inverse S&P 500 Fund (SH) will have a Money Wave Buy today.

Help Us Help Animals

Help Us Help Animals

Recent Comments

  • Market Breadth Indicators: A Trader’s Guide to Early Trend Detection on Backtesting: Definition and How a Trading Strategy Backtest Works
  • Island Reversal Pattern: Definition and Formation Explained on Double Top Pattern: How to Identify and Trade This Reversal Signal
  • Channel Pattern Guide: What It Is and Why It Matters on A Guide to Forecasting Using Moving Averages
  • What Is a Broadening Bottom Chart Pattern? Full Guide on Bull vs. Bear Market: An Investor’s Guide to Market Phases
  • ATGL Weekly Money Flow - 2025-05-11 on ATGL Top Pick of the Week! Apr 6, 2025

Become a Green Liner!

Help me make more Money in the Stock Market.

ON ATGL

  • DashBoard
  • Weekly Commentary
  • Daily Buy / Sell Signals
  • Day Trade Setup
  • Trading Rooms

Design & Develop By Pixelvect

STRATEGIES

  • Swing Trading
  • ATGL Pick of the Week
  • Dividend Growth
  • ETF Sector Rotation
  • Dogs of the Dow

HELP

  • ATGL Trading Rules
  • FAQ
  • Account Maintenance
  • Contact US
  • Join

FOLLOW US

Instagram Linkedin Twitter Facebook

© COPYRIGHT 2024 · ABOVETHEGREENLINE.COM · ALL RIGHTS RESERVED · PRIVACY · TERMS · CONTACT · WATCHLIST · CURRENT