Above the Green Line -01
  • Market Insights
        • Commentary
          • Daily
          • Weekly
        • BUY / SELL SIGNALS
          • Trade Posts
          • Recent Trade Alerts
          • Recent Day Trades
        • BLOGROLL
          • Dividend Growth Blog
          • ETF Sector Blog
          • Dow Dogs
          • TPOW Blog
  • Strategies
        • SWING TRADING
          • Current Positions
          • Watchlists
          • Closed Positions
          • Candidates - TOP 100
          • Specialty Stocks
        • WEEKLY STOCK PICK
          • TPOW Charts
          • TPOW Performance
          • TPOW Strategy Guide
          • TPOW Performance Dashboard
        • DAY TRADING
          • Watch List
        • ATGL DASHBOARD
        • ETF STRATEGIES
          • ETF Sector Rotation
          • ETF Sector Portfolio
        • DIVIDEND GROWTH
          • Dividend Growth Portfolio
          • Dividend Calendar
        • DOGS OF THE DOW
          • Dogs of the Dow Portfolio
          • DOW 5 Portfolio
  • Markets
        • US MARKET
          • Commodities
          • Energy
          • Precious Metals
          • Volatility
        • GLOBAL MARKETS
          • Market Indices
          • Economic Calendar
          • FOREX Heat Map
          • FOREX Cross Rates
          • Crypto Currency Market
  • Investing
    • Discord Community
    • Dashboard
  • Resources
        • ARTICLES
          • Dividend Growth Model Articles
          • ETF Articles
          • Investment Strategies Articles
          • Market and Economic Insights
          • Stock Trade Articles
          • Stock Reviews
        • TOOLS
          • Stock Scanners
          • Charting Software
          • Brokerage Firms
        • STOCK CHARTS
          • Key Components
          • Reading Charts
          • Drawing Stock Charts
          • Identifying Trends
        • RETIREMENT PLANNING
  • About
    • Contact Us
    • How to Win
    • #1 At Stockcharts
    • Disclaimer
    • FAQ
  • Log In
  • Subscribe

May 4, 2021

Money Wave Alert! May 4, 2021

QQQ Chart
The NASDAQ 100 Fund (QQQ) quickly dropped down to the Red Line (50-day avg.)

Markets were lower higher today as the Tech Stocks dumped. Treasury Secretary Yellen Says Interest Rates may have to rise to keep the Economy from overheating. Oh my, what a surprise, and the Bond Market agrees with Yellen. But the FED says Low Rates all year. Who do we believe?

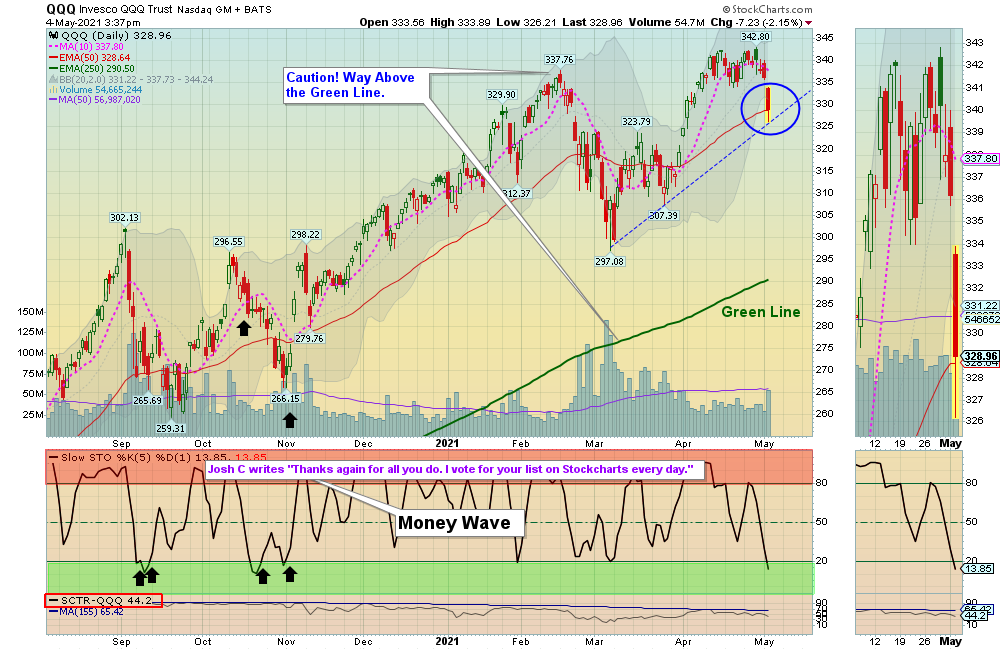
Let’s just Follow the Money, not paid Bureaucrats. The Long Bond has dropped 20 % in the last year, telling us that the Economy and Inflation have picked up. The Stock Markets are Way Above the Green Line on hopes of Low Interest Rates all year. But we also know that the Markets will return to the Green Lines…

The S&P 500 and the NYSE slipped below the Pink Lines (10-day avgs.) today, which created Short Term Sell Signals. The Indices were up in the Red Zones (probably too late to Buy for the Short Term).

Trading would be better if the Markets could pull back down to the Red Lines (50-day avgs.) like the NASDAQ 100 did today. This would bring in more Buyers. Don’t Buy Investments when they are in the Red Zones (probably too late to Buy for the Short Term).

NEW SUBSCRIBERS: Please WAIT for the Watch List below to become larger to set up some good trades. The better trades happen when the S&P 500 Index is also in the Green Zone. 

Several new adds today to DAY TRADING SETUPS

Bonds  were up today, but are below the Green Line.

Crude Oil was up $1.20 today at $66.69.

BUYS TODAY    5/4/2021  NONE TODAY

 _______________________________________________________________________________________________________

NEW! JUMP START SCROLLING CHARTS: (Buy Signal should be very soon… Click on the Jump Start link for more info.)      

AMAT      APPLIED MATERIALS      Wait for Money Wave Close > 20 with High Volume.   

MVIS      MICROVISION INC.      Wait for Money Wave Close > 20 with High Volume.     

TRIP      TRIPADVISOR INC.      Buy above $49.28 with High Volume with a 5% Trailing Sell Stop Loss below it.

____________________________________________________________________________________________________________

WATCH LIST

WATCH LIST SCROLLING CHARTS (Real Time)       

BCRX      BIOCRYST PHARMA.      Wait for Money Wave Close > 20 with High Volume.     

KOPN      KOPIN CORP.      Wait for Money Wave Close > 20 with High Volume.

NWSA      NEWS CORP.      Money Wave must Close in the Green Zone.

STKL      SUN OPTA INC.      Buy above the Pink Line with High Volume with a 5% Trailing Sell Stop Loss below it.     

STX      SEAGATE TECH HOLDINGS        Money Wave must Close in the Green Zone.

Please be patient and wait for Money Wave Buy Signals.  We will email you when they are ready. Follow on the WATCH LIST.
Emotions are very high now, so please do not Buy unless you are VERY NIMBLE.

The Leaders are Way Above the Green Lines (all Investments eventually return to their Green Lines).      

____________________________________________________________________________________________________________

SELLS TODAY   

CLNE      CLEAN ENERGY FUELS      Stopped Out today as CLNE slipped below the Buy Price of $10.81.       

Click for  CURRENT POSITION CHARTS – Real Time  (Please check and adjust your Sell Stops).         
Click for  CLOSED POSITIONS,   
NEW:       MY TRADING DASHBOARD

DAY TRADING SETUPS
NEW:  TRADE ALERTS
ARE YOUR INVESTMENTS ABOVE THE GREEN LINE?
ETF SECTOR ROTATION SYSTEM   
TOP 100 LIST Updated May 1, 2021

Many like to Buy the day before, near the Close, if the Money Wave is going to create a Buy Signal (Closing > 20 and out of the Green Zone).

Don’t Buy if the Investment has already popped up too much. Money Wave Buys are usually good for a 3-6 %  move in a few days.

We will “Not Log” trades if the Reward/Risk is not at least 2:1, or Low Volume. These have more risk.   

Related Post

– Money Wave Alert! May 3, 2021

Subscribe to Our Newsletter

AGL Logo

Get our eBook Now!

Candlestick - A Swing Traders Friend

We don’t spam! Read our privacy policy for more info.

You’ve been successfully subscribed to our newsletter!

Voted #1 at Stock Charts

SH Chart
Inverse S&P 500 Fund (SH) will have a Money Wave Buy today.

Help Us Help Animals

Help Us Help Animals

Recent Comments

  • Market Breadth Indicators: A Trader’s Guide to Early Trend Detection on Backtesting: Definition and How a Trading Strategy Backtest Works
  • Island Reversal Pattern: Definition and Formation Explained on Double Top Pattern: How to Identify and Trade This Reversal Signal
  • Channel Pattern Guide: What It Is and Why It Matters on A Guide to Forecasting Using Moving Averages
  • What Is a Broadening Bottom Chart Pattern? Full Guide on Bull vs. Bear Market: An Investor’s Guide to Market Phases
  • ATGL Weekly Money Flow - 2025-05-11 on ATGL Top Pick of the Week! Apr 6, 2025

Become a Green Liner!

Help me make more Money in the Stock Market.

ON ATGL

  • DashBoard
  • Weekly Commentary
  • Daily Buy / Sell Signals
  • Day Trade Setup
  • Trading Rooms

Design & Develop By Pixelvect

STRATEGIES

  • Swing Trading
  • ATGL Pick of the Week
  • Dividend Growth
  • ETF Sector Rotation
  • Dogs of the Dow

HELP

  • ATGL Trading Rules
  • FAQ
  • Account Maintenance
  • Contact US
  • Join

FOLLOW US

Instagram Linkedin Twitter Facebook

© COPYRIGHT 2024 · ABOVETHEGREENLINE.COM · ALL RIGHTS RESERVED · PRIVACY · TERMS · CONTACT · WATCHLIST · CURRENT