Above the Green Line -01
  • Market Insights
        • Commentary
          • Daily
          • Weekly
        • BUY / SELL SIGNALS
          • Trade Posts
          • Recent Trade Alerts
          • Recent Day Trades
        • BLOGROLL
          • Dividend Growth Blog
          • ETF Sector Blog
          • Dow Dogs
          • TPOW Blog
  • Strategies
        • SWING TRADING
          • Current Positions
          • Watchlists
          • Closed Positions
          • Candidates - TOP 100
          • Specialty Stocks
        • WEEKLY STOCK PICK
          • TPOW Charts
          • TPOW Performance
          • TPOW Strategy Guide
          • TPOW Performance Dashboard
        • DAY TRADING
          • Watch List
        • ATGL DASHBOARD
        • ETF STRATEGIES
          • ETF Sector Rotation
          • ETF Sector Portfolio
        • DIVIDEND GROWTH
          • Dividend Growth Portfolio
          • Dividend Calendar
        • DOGS OF THE DOW
          • Dogs of the Dow Portfolio
          • DOW 5 Portfolio
  • Markets
        • US MARKET
          • Commodities
          • Energy
          • Precious Metals
          • Volatility
        • GLOBAL MARKETS
          • Market Indices
          • Economic Calendar
          • FOREX Heat Map
          • FOREX Cross Rates
          • Crypto Currency Market
  • Investing
    • Discord Community
    • Dashboard
  • Resources
        • ARTICLES
          • Dividend Growth Model Articles
          • ETF Articles
          • Investment Strategies Articles
          • Market and Economic Insights
          • Stock Trade Articles
          • Stock Reviews
        • TOOLS
          • Stock Scanners
          • Charting Software
          • Brokerage Firms
        • STOCK CHARTS
          • Key Components
          • Reading Charts
          • Drawing Stock Charts
          • Identifying Trends
        • RETIREMENT PLANNING
  • About
    • Contact Us
    • How to Win
    • #1 At Stockcharts
    • Disclaimer
    • FAQ
  • Log In
  • Subscribe

May 25, 2021

Money Wave Alert! May 25, 2021

XLK Chart
The Tech Fund (XLK) is struggling and is already back up in the Red Zone.

Markets were slightly lower today as the Buying has basically dried up. Many of the Big Cap and Big Tech Stocks are back up in the Red Zones (probably too late to Buy for the Short Term). The DOW 30 and S&P 500 Indices are trying to complete a Bullish “W” Pattern back up to re-test the recent Highs. Then the DOW 30 Index and the S&P 500 would need to make Higher Highs to avoid a “Double Top”. 

The leading Metals Stocks are correcting down near the Red Lines and should pop back up again soon. Momentum Stocks are slowly perking back up and are trying to bottom after many corrected down near the Green Lines. If the Relative Strength can stay above 80 after these big pull-backs, then they should be able to pop up again.

NEW SUBSCRIBERS: Please WAIT for Money Wave Buy Signals (below) with High Volume. The Low Volume recently has WARNED us against Buying much at this time. The Watch List has grown as many Momentum have pulled back down into the Green Zones for Money Wave Buy Signals soon. The better trades happen when the S&P 500 Index is also in the Green Zone. 

Some new adds on DAY TRADING SETUPS

Bonds  were up today, but are below the Green Line.

Crude Oil was down $0.12 today at $65.93.

BUYS TODAY    5/25/2021   

BTX      BROOKLYN IMMUNO      Money Wave Buy today. Target is $40.00. EXIT if it is going to Close below Support of $13.32. This is a Wild One!


VUZI      VUZIX CORP.       Traded above $17.41 today, but the Volume was Low, so VUZI will not be bought or logged.

We will “Not Log” trades if the Reward/Risk is not at least 2:1, or Low Volume. These have more risk.

_______________________________________________________________________________________________________

JUMP START SCROLLING CHARTS: (Buy Signal should be very soon… Click on the Jump Start link for more info.)    

AA      ALCOA CORP.      Wait for Money Wave Close > 20 with High Volume.       

AEO      AMER. EAGLE OUTFITTERS      Wait for Money Wave Close > 20 with High Volume. 

RIOT      RIOT BLOCKCHAIN    Buy above $26.95 with High Volume with a 5% Trailing Sell Stop Loss below it.          

____________________________________________________________________________________________________________

WATCH LIST

WATCH LIST SCROLLING CHARTS (Real Time)           

BTU      PEABODY ENERGY CORP.       Wait for Money Wave Close > 20 with High Volume. 

CLNE      CLEAN ENERGY FUELS    Buy above $8.65 with High Volume with a 5% Trailing Sell Stop Loss below it.      

OCGN      OCUGEN INC.      Buy above $9.59 with High Volume with a 5% Trailing Sell Stop Loss below it.

VALE      VALE STEEL SA      Wait for Money Wave Close > 20 with High Volume.  (2nd Buy Signal soon)

Please be patient and wait for Money Wave Buy Signals.  We will email you when they are ready. Follow on the WATCH LIST.
Emotions are very high now, so please do not Buy unless you are VERY NIMBLE.

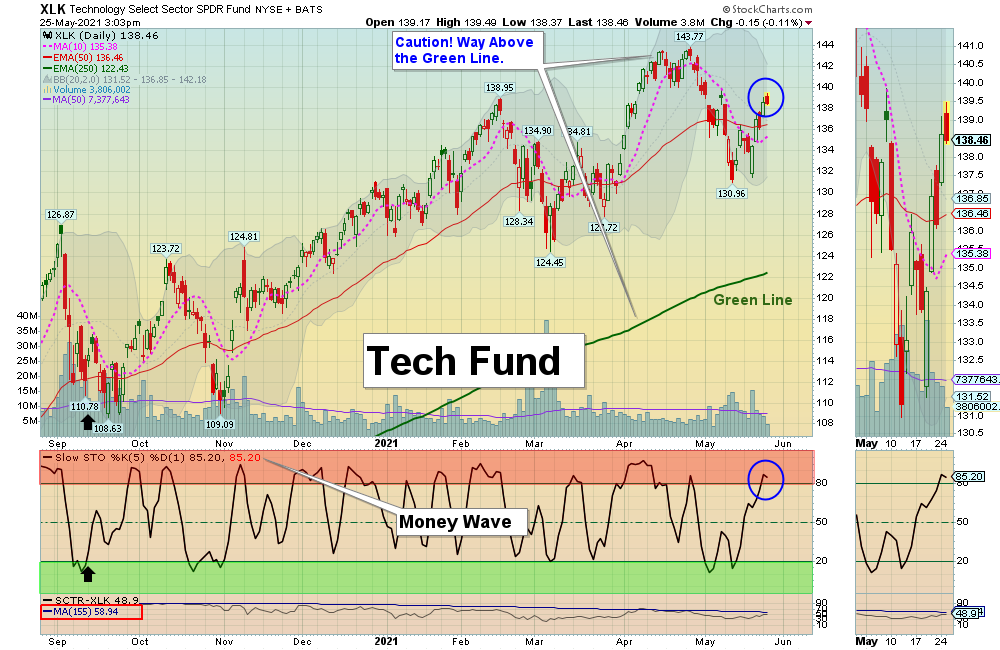
The Leaders are Way Above the Green Lines (all Investments eventually return to their Green Lines).      

____________________________________________________________________________________________________________

SELLS TODAY   

BCRX      BIOCRYST PHARMA.      EXIT if it is going to Close below the Pink Line around $13.48. This trade was not logged. 

STKL      SUNOPTA INC.      EXIT if it is going to Close below the Pink Line around $12.60.      

Click for  CURRENT POSITION CHARTS – Real Time  (Please check and adjust your Sell Stops).         
Click for  CLOSED POSITIONS,   
NEW:       MY TRADING DASHBOARD

DAY TRADING SETUPS
NEW:  TRADE ALERTS
ARE YOUR INVESTMENTS ABOVE THE GREEN LINE?
ETF SECTOR ROTATION SYSTEM   
TOP 100 LIST Updated May 1, 2021

Many like to Buy the day before, near the Close, if the Money Wave is going to create a Buy Signal (Closing > 20 and out of the Green Zone).

Don’t Buy if the Investment has already popped up too much. Money Wave Buys are usually good for a 3-6 %  move in a few days.

We will “Not Log” trades if the Reward/Risk is not at least 2:1, or Low Volume. These have more risk. 

Related Post

– Money Wave Alert! May 24, 2021

Subscribe to Our Newsletter

AGL Logo

Get our eBook Now!

Candlestick - A Swing Traders Friend

We don’t spam! Read our privacy policy for more info.

You’ve been successfully subscribed to our newsletter!

Voted #1 at Stock Charts

SH Chart
Inverse S&P 500 Fund (SH) will have a Money Wave Buy today.

Help Us Help Animals

Help Us Help Animals

Recent Comments

  • Market Breadth Indicators: A Trader’s Guide to Early Trend Detection on Backtesting: Definition and How a Trading Strategy Backtest Works
  • Island Reversal Pattern: Definition and Formation Explained on Double Top Pattern: How to Identify and Trade This Reversal Signal
  • Channel Pattern Guide: What It Is and Why It Matters on A Guide to Forecasting Using Moving Averages
  • What Is a Broadening Bottom Chart Pattern? Full Guide on Bull vs. Bear Market: An Investor’s Guide to Market Phases
  • ATGL Weekly Money Flow - 2025-05-11 on ATGL Top Pick of the Week! Apr 6, 2025

Become a Green Liner!

Help me make more Money in the Stock Market.

ON ATGL

  • DashBoard
  • Weekly Commentary
  • Daily Buy / Sell Signals
  • Day Trade Setup
  • Trading Rooms

Design & Develop By Pixelvect

STRATEGIES

  • Swing Trading
  • ATGL Pick of the Week
  • Dividend Growth
  • ETF Sector Rotation
  • Dogs of the Dow

HELP

  • ATGL Trading Rules
  • FAQ
  • Account Maintenance
  • Contact US
  • Join

FOLLOW US

Instagram Linkedin Twitter Facebook

© COPYRIGHT 2024 · ABOVETHEGREENLINE.COM · ALL RIGHTS RESERVED · PRIVACY · TERMS · CONTACT · WATCHLIST · CURRENT