Above the Green Line -01
  • Market Insights
        • Commentary
          • Daily
          • Weekly
        • BUY / SELL SIGNALS
          • Trade Posts
          • Recent Trade Alerts
          • Recent Day Trades
        • BLOGROLL
          • Dividend Growth Blog
          • ETF Sector Blog
          • Dow Dogs
          • TPOW Blog
  • Strategies
        • SWING TRADING
          • Current Positions
          • Watchlists
          • Closed Positions
          • Candidates - TOP 100
          • Specialty Stocks
        • WEEKLY STOCK PICK
          • TPOW Charts
          • TPOW Performance
          • TPOW Strategy Guide
          • TPOW Performance Dashboard
        • DAY TRADING
          • Watch List
        • ATGL DASHBOARD
        • ETF STRATEGIES
          • ETF Sector Rotation
          • ETF Sector Portfolio
        • DIVIDEND GROWTH
          • Dividend Growth Portfolio
          • Dividend Calendar
        • DOGS OF THE DOW
          • Dogs of the Dow Portfolio
          • DOW 5 Portfolio
  • Markets
        • US MARKET
          • Commodities
          • Energy
          • Precious Metals
          • Volatility
        • GLOBAL MARKETS
          • Market Indices
          • Economic Calendar
          • FOREX Heat Map
          • FOREX Cross Rates
          • Crypto Currency Market
  • Investing
    • Discord Community
    • Dashboard
  • Resources
        • ARTICLES
          • Dividend Growth Model Articles
          • ETF Articles
          • Investment Strategies Articles
          • Market and Economic Insights
          • Stock Trade Articles
          • Stock Reviews
        • TOOLS
          • Stock Scanners
          • Charting Software
          • Brokerage Firms
        • STOCK CHARTS
          • Key Components
          • Reading Charts
          • Drawing Stock Charts
          • Identifying Trends
        • RETIREMENT PLANNING
  • About
    • Contact Us
    • How to Win
    • #1 At Stockcharts
    • Disclaimer
    • FAQ
  • Log In
  • Subscribe

June 9, 2022

Money Wave Alert! Jun 9, 2022

We’re waiting to see if bonds will make a double bottom.

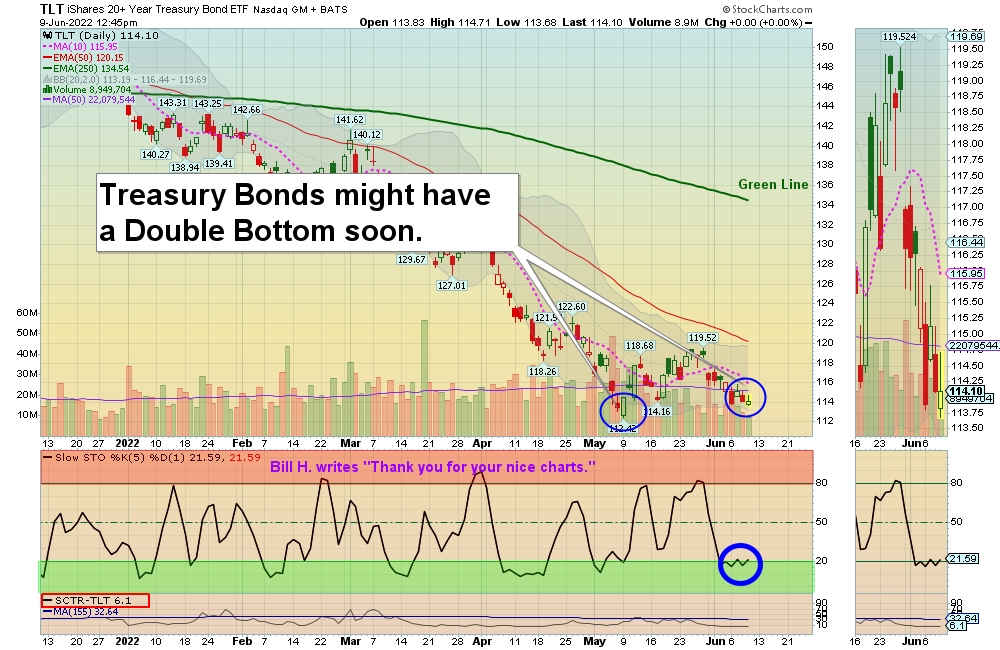
Markets were lower today as the Indices slipped below the Pink Lines (10-day avgs.) for short term Sell Signals. We’re waiting to see if Bonds will make a double bottom soon. Bonds are actually starting to enter a buy signal, but we should still avoid them because of extremely low Relative Strength. 

Most of the Leaders and Indices are coming down from the Red Zones (probably too late to Buy for the Short Term). Long Term Interest Rates are struggling to go back up to re-test the Highs, and could Fail soon. The Volume was still below average again today on Stocks which indicates indecision. 

The Markets and most Investments are still fairly weak (Below the Green Lines), so please be patient wait for more Money Wave Buy Signals. BUYS SOON – CHARTS  The best moves are when the S&P 500 Index is also coming up out of the Green Zone (Now getting closer to the Green Zone). 

BUYS TODAY    6/9/2022  

RWM      INVERSE SMALL CAP FUND      Money Wave Buy today, but RWM will not be bought or logged as the volume is below average of 3.5 MIL.

We will “Not Log” trades if the Reward/Risk is not at least 2:1, or Low Volume. These have more risk. 

BUYS TOMORROW – SWING TRADING STOCKS 

Shop for a better price earlier in the day with Triple Buy Signal, on the same day that a Daily Money Wave Buy Signal will occur.  

CF      CF INDUSTRIES HOLDINGS      Wait for Money Wave Close > 20 with High Volume.

MOS      MOSAIC CO      Wait for Money Wave Close > 20 with High Volume.

BUYS SOON – CHARTS      WATCH LIST    

EWZ      iSHARES BRAZIL FUND      Wait for Money Wave Close > 20 with High Volume.    

INDO      INDONESIA ENERGY CORP      Wait for Money Wave Close > 20 with High Volume.

SBLK      STAR BULK CARRIERS      Wait for Money Wave Close > 20 with High Volume.

Please be patient and wait for Money Wave Buy Signals.  We will email you when they are ready. Follow on the WATCH LIST.      
The Leaders are Way Above the Green Lines (all Investments eventually return to their Green Lines).   

SELLS TODAY   

LLY      ELI LILLY & CO.      Exit if it is going to close below the 3 % Trailing Sell Stop Loss of $306.03.

SWN      SOUTHWESTERN ENERGY CO      Exit if it is going to close below the Pink Line around $9.31. The Target was already hit for a 13.7 % Gain.         
___________________________________________________________________________________________________________________

DAY TRADING SETUPS. No good Triple Buy Pops today. Try out the New Side by Side layout.   

DAY TRADING FOR INDICES & LARGE CAPS CHARTS.

Bonds were up slightly today, and are Way Below the Green Line.  

Crude Oil was down $0.33 at $121.84.

MY TRADING DASHBOARD 
SWING TRADING CURRENT POSITIONS
DAY TRADING SETUPS
TRADE ALERTS
GREEN LINE CHARTS AT STOCKCHARTS
ARE YOUR INVESTMENTS ABOVE THE GREEN LINE?
GREEN LINE RULES
ETF SECTOR ROTATION SYSTEM   
New TOP 100 LIST Updated Jun 3, 2022

Many like to Buy the Swing Trades just before the Close, if the Money Wave is going to create a Buy Signal (Closing > 20 and up out of the Green Zone).

Don’t Buy if the Investment has already popped up too much. Money Wave Buy Signals are usually good for a 3-6 %  move in a few days.

We will “Not Log” trades if the Reward/Risk is not at least 2:1, or Low Volume. These have more risk. 

Related Post

– RWM

Subscribe to Our Newsletter

AGL Logo

Get our eBook Now!

Candlestick - A Swing Traders Friend

We don’t spam! Read our privacy policy for more info.

You’ve been successfully subscribed to our newsletter!

Voted #1 at Stock Charts

SH Chart
Inverse S&P 500 Fund (SH) will have a Money Wave Buy today.

Help Us Help Animals

Help Us Help Animals

Recent Comments

  • Market Breadth Indicators: A Trader’s Guide to Early Trend Detection on Backtesting: Definition and How a Trading Strategy Backtest Works
  • Island Reversal Pattern: Definition and Formation Explained on Double Top Pattern: How to Identify and Trade This Reversal Signal
  • Channel Pattern Guide: What It Is and Why It Matters on A Guide to Forecasting Using Moving Averages
  • What Is a Broadening Bottom Chart Pattern? Full Guide on Bull vs. Bear Market: An Investor’s Guide to Market Phases
  • ATGL Weekly Money Flow - 2025-05-11 on ATGL Top Pick of the Week! Apr 6, 2025

Become a Green Liner!

Help me make more Money in the Stock Market.

ON ATGL

  • DashBoard
  • Weekly Commentary
  • Daily Buy / Sell Signals
  • Day Trade Setup
  • Trading Rooms

Design & Develop By Pixelvect

STRATEGIES

  • Swing Trading
  • ATGL Pick of the Week
  • Dividend Growth
  • ETF Sector Rotation
  • Dogs of the Dow

HELP

  • ATGL Trading Rules
  • FAQ
  • Account Maintenance
  • Contact US
  • Join

FOLLOW US

Instagram Linkedin Twitter Facebook

© COPYRIGHT 2024 · ABOVETHEGREENLINE.COM · ALL RIGHTS RESERVED · PRIVACY · TERMS · CONTACT · WATCHLIST · CURRENT