Above the Green Line -01
  • Market Insights
        • Commentary
          • Daily
          • Weekly
        • BUY / SELL SIGNALS
          • Trade Posts
          • Recent Trade Alerts
          • Recent Day Trades
        • BLOGROLL
          • Dividend Growth Blog
          • ETF Sector Blog
          • Dow Dogs
          • TPOW Blog
  • Strategies
        • SWING TRADING
          • Current Positions
          • Watchlists
          • Closed Positions
          • Candidates - TOP 100
          • Specialty Stocks
        • WEEKLY STOCK PICK
          • TPOW Charts
          • TPOW Performance
          • TPOW Strategy Guide
          • TPOW Performance Dashboard
        • DAY TRADING
          • Watch List
        • ATGL DASHBOARD
        • ETF STRATEGIES
          • ETF Sector Rotation
          • ETF Sector Portfolio
        • DIVIDEND GROWTH
          • Dividend Growth Portfolio
          • Dividend Calendar
        • DOGS OF THE DOW
          • Dogs of the Dow Portfolio
          • DOW 5 Portfolio
  • Markets
        • US MARKET
          • Commodities
          • Energy
          • Precious Metals
          • Volatility
        • GLOBAL MARKETS
          • Market Indices
          • Economic Calendar
          • FOREX Heat Map
          • FOREX Cross Rates
          • Crypto Currency Market
  • Investing
    • Discord Community
    • Dashboard
  • Resources
        • ARTICLES
          • Dividend Growth Model Articles
          • ETF Articles
          • Investment Strategies Articles
          • Market and Economic Insights
          • Stock Trade Articles
          • Stock Reviews
        • TOOLS
          • Stock Scanners
          • Charting Software
          • Brokerage Firms
        • STOCK CHARTS
          • Key Components
          • Reading Charts
          • Drawing Stock Charts
          • Identifying Trends
        • RETIREMENT PLANNING
  • About
    • Contact Us
    • How to Win
    • #1 At Stockcharts
    • Disclaimer
    • FAQ
  • Log In
  • Subscribe

June 3, 2020

Money Wave Alert! Jun 3, 2020

SPX 60 Chart
The S&P 500 Index is still working on Wave 5 up.

Markets were up again today as the Herd is getting back in the Markets on Good News after a 40 % rally. Several Leaders are now 100% Above their Green Lines! This is how Tammy loses Money, as she Sells on FEAR (March Lows from Virus) and Buys on Good News (Employees returning back to work). The Green Line System was Buying on FEAR in March when many were taking huge losses. When Investments like the Leaders are Way Above the Green Lines, Investor’s Emotions & Greed have caused them to panic Buy and pay too much (Investments always return near their Green Lines).

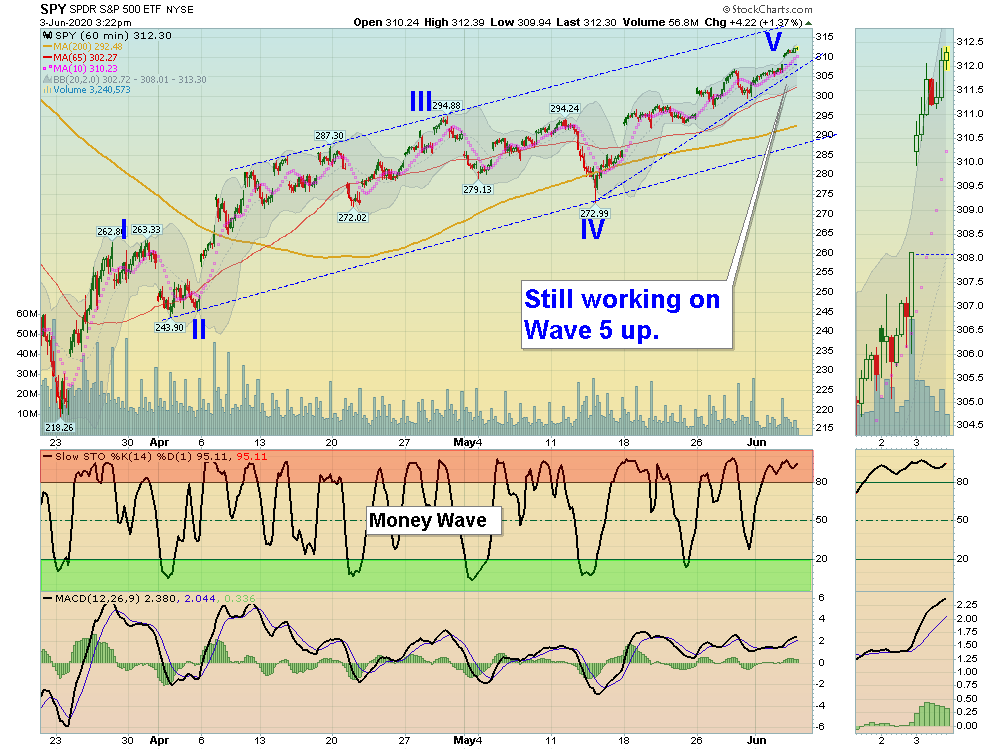
The S&P 500 Index looks like it is still in Wave 5 up since the March Lows (The Count is up to 3215). The NASDAQ 100 Index is slower today as many Stocks are fully priced and the Money has been rolling into the Weaker Stocks and Indices. The S&P 500 Index is holding above the Pink Line (10-day avg.) of 3024 to avoid going into a Short Term Sell Signal.

NEW SUBSCRIBERS: If you are a cautious Investor, remember that the better trades happen when the The S&P 500 is also back down to the Green Zone (now in the Red Zone). 

Please remember that the Markets have bounced up about 40 % from the March Lows, and are currently over-bought. Do you have discipline to WAIT?

Bonds  were down again today.

Crude Oil was down $0.36 today at $36.62.


The Following Investments will probably have a Money Wave Buy Signal soon. (Slow Stochastic Closing > 20) on today’s Close.

BUYS TODAY    6/03/2020  NONE TODAY      

WAIT for the Leaders to return back down to their Green Zones.

NEW TOP 100 LIST Updated June 1, 2020


“JUMP START” Candidates:  (Buy Signal should be very soon… Click on the Jump Start link for more info.)     

TGTX     TG THERA.

_______________________________________________________________________________________________________________________________________________ 

Money Wave Buys Signals Soon (3 Days- 3 Weeks Short Term):   (Best to Buy these when the S&P 500 is also in the Green Zone.)    

BCRX     BIOCRYST PHARMA.     Money Wave must Close in the Green Zone. 

SRNE     SORRENTO THERA.

VOLATILITY INDEX      Buy if it is going to Close above $35.43 on High Volume.


Please be patient and wait for Money Wave Buy Signals.  We will email you when they are ready. Follow on the WATCH LIST.

Emotions are very high now, so please do not Buy unless you are VERY NIMBLE.

The Leaders are Way Above the Green Lines (all Investments eventually return to their Green Lines).

___________________________________________________________________________________________________

SELLS TODAY       


ATVI     ACTIVISION      EXIT if it is going to Close below the Pink Line around $71.85.

NEM     NEWMONT CORP.     EXIT if it is going to Close below your Buy Price or $58.47. 


ENPH      ENPHASE ENERGY      EXIT if it is going to Close below your Buy Price or $55.80.  This trade was not logged. 

GMNK     GENMARK DIAGNOSTICS    EXIT if it is going to Close below your Buy Price or $9.57. This trade was not logged. 


Click for   PORTFOLIO  (Open Positions) and adjust your Sell Stops. 

Click for  CLOSED POSITIONS,   

ARE YOUR iNVESTMENTS ABOVE THE GREEN LINE?

ETF SECTOR ROTATION SYSTEM   

NEW TOP 100 LIST Updated June 1, 2020


Many like to Buy the day before, near the Close, if the Money Wave is going to create a Buy Signal (Closing > 20 and out of the Green Zone).

Don’t Buy if the Investment has already popped up too much. Money Wave Buys are usually good for a 3-6 %  move in a few days.

We will “Not Log” trades if the Reward/Risk is not at least 2:1.

Related Post

– Money Wave Alert! Jun 2, 2020

Subscribe to Our Newsletter

AGL Logo

Get our eBook Now!

Candlestick - A Swing Traders Friend

We don’t spam! Read our privacy policy for more info.

You’ve been successfully subscribed to our newsletter!

Voted #1 at Stock Charts

SH Chart
Inverse S&P 500 Fund (SH) will have a Money Wave Buy today.

Help Us Help Animals

Help Us Help Animals

Recent Comments

  • Market Breadth Indicators: A Trader’s Guide to Early Trend Detection on Backtesting: Definition and How a Trading Strategy Backtest Works
  • Island Reversal Pattern: Definition and Formation Explained on Double Top Pattern: How to Identify and Trade This Reversal Signal
  • Channel Pattern Guide: What It Is and Why It Matters on A Guide to Forecasting Using Moving Averages
  • What Is a Broadening Bottom Chart Pattern? Full Guide on Bull vs. Bear Market: An Investor’s Guide to Market Phases
  • ATGL Weekly Money Flow - 2025-05-11 on ATGL Top Pick of the Week! Apr 6, 2025

Become a Green Liner!

Help me make more Money in the Stock Market.

ON ATGL

  • DashBoard
  • Weekly Commentary
  • Daily Buy / Sell Signals
  • Day Trade Setup
  • Trading Rooms

Design & Develop By Pixelvect

STRATEGIES

  • Swing Trading
  • ATGL Pick of the Week
  • Dividend Growth
  • ETF Sector Rotation
  • Dogs of the Dow

HELP

  • ATGL Trading Rules
  • FAQ
  • Account Maintenance
  • Contact US
  • Join

FOLLOW US

Instagram Linkedin Twitter Facebook

© COPYRIGHT 2024 · ABOVETHEGREENLINE.COM · ALL RIGHTS RESERVED · PRIVACY · TERMS · CONTACT · WATCHLIST · CURRENT