Above the Green Line -01
  • Market Insights
        • Commentary
          • Daily
          • Weekly
        • BUY / SELL SIGNALS
          • Trade Posts
          • Recent Trade Alerts
          • Recent Day Trades
        • BLOGROLL
          • Dividend Growth Blog
          • ETF Sector Blog
          • Dow Dogs
          • TPOW Blog
  • Strategies
        • SWING TRADING
          • Current Positions
          • Watchlists
          • Closed Positions
          • Candidates - TOP 100
          • Specialty Stocks
        • WEEKLY STOCK PICK
          • TPOW Charts
          • TPOW Performance
          • TPOW Strategy Guide
          • TPOW Performance Dashboard
        • DAY TRADING
          • Watch List
        • ATGL DASHBOARD
        • ETF STRATEGIES
          • ETF Sector Rotation
          • ETF Sector Portfolio
        • DIVIDEND GROWTH
          • Dividend Growth Portfolio
          • Dividend Calendar
        • DOGS OF THE DOW
          • Dogs of the Dow Portfolio
          • DOW 5 Portfolio
  • Markets
        • US MARKET
          • Commodities
          • Energy
          • Precious Metals
          • Volatility
        • GLOBAL MARKETS
          • Market Indices
          • Economic Calendar
          • FOREX Heat Map
          • FOREX Cross Rates
          • Crypto Currency Market
  • Investing
    • Discord Community
    • Dashboard
  • Resources
        • ARTICLES
          • Dividend Growth Model Articles
          • ETF Articles
          • Investment Strategies Articles
          • Market and Economic Insights
          • Stock Trade Articles
          • Stock Reviews
        • TOOLS
          • Stock Scanners
          • Charting Software
          • Brokerage Firms
        • STOCK CHARTS
          • Key Components
          • Reading Charts
          • Drawing Stock Charts
          • Identifying Trends
        • RETIREMENT PLANNING
  • About
    • Contact Us
    • How to Win
    • #1 At Stockcharts
    • Disclaimer
    • FAQ
  • Log In
  • Subscribe

June 21, 2021

Money Wave Alert! Jun 21. 2021

DIA Chart
The DOW 30 Index slipped below the Red Line (50-day avg.)

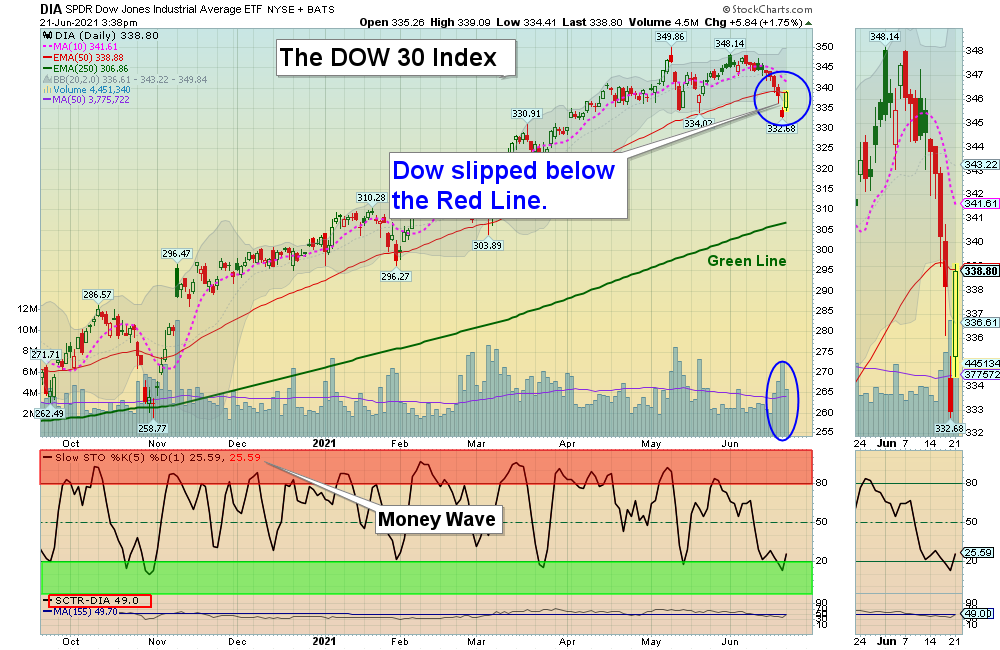
Markets were higher today as the S&P 500 Index bounced nicely up off the Red Line (50-day avg.) Now it must make new Highs for this rally to continue.  The DOW 30 Index has become weaker and is still below the Red Line. But the NASDAQ 100 is now back up near Highs. So the Money is basically rotating between the Indices and not leaving the Markets.

But the Low Volume is worry some, and historically you need heavy Buying to go much higher. Also the very Largest Stocks are going up more, which have a big weighting in the S&P 500  and NAS 100 Indices. This tends to mask the weakness in the breadth of the Market. Purposely done?  Don’t know, but historically this happens in a tired Market.

NEW SUBSCRIBERS:  Please WAIT for the Volume to improve. The low Volume recently has WARNED us against Buying much at this time. The better trades happen when the S&P 500 Index is also in the Green Zone (very soon!). 

Buy Signals soon on DAY TRADING SETUPS

Bonds  were down today, and are below the Green Line.

Crude Oil was up $1.34 today at $73.48. 

BUYS TODAY    6/21/2021   

BNTX      BIONTECH SE    Bought above $217.10 today but BNTX will not be logged as the Volume is below average of 3.4 MIL.

DBC      COMMODITY FUND      Money Wave Buy today but DBC will not be logged as the Volume is below average of 3.6 MIL.

TELL      TELLURIAN INC.      Money Wave Buy today but TELL will not be logged as it is already up 9 % today.

_______________________________________________________________________________________________________

JUMP START SCROLLING CHARTS: (Buy Signal should be very soon… Click on the Jump Start link for more info.)       

BTU      PEABODY ENERGY        Wait for Money Wave Close > 20 with High Volume.       

CLF      CLEVELAND CLIFFS INC.      Wait for Money Wave Close > 20 with High Volume.     

____________________________________________________________________________________________________________

WATCH LIST

WATCH LIST SCROLLING CHARTS (Real Time)             

BB      BLACKBERRY LTD.     Buy above the Pink Line around $13.91 with High Volume with a 5% Trailing Sell Stop Loss below it.         

GT      GOODYEAR TIRE      Wait for Money Wave Close > 20 with High Volume.

LB      L BRANDS INC.       Money Wave must Close in the Green Zone.     

TSLA      TESLA INC.     Buy above $635.59 with High Volume with a 5% Trailing Sell Stop Loss below it.

UONE      URBAN ONE INC.      Wait for Money Wave Close > 20 with High Volume.

Please be patient and wait for Money Wave Buy Signals.  We will email you when they are ready. Follow on the WATCH LIST.
Emotions are very high now, so please do not Buy unless you are VERY NIMBLE.

The Leaders are Way Above the Green Lines (all Investments eventually return to their Green Lines).      

____________________________________________________________________________________________________________

SELLS TODAY    NONE TODAY

Click for  CURRENT POSITION CHARTS – Real Time  (Please check and adjust your Sell Stops).         
Click for  CLOSED POSITIONS,   
NEW:       MY TRADING DASHBOARD

DAY TRADING SETUPS
NEW:  TRADE ALERTS
ARE YOUR INVESTMENTS ABOVE THE GREEN LINE?
ETF SECTOR ROTATION SYSTEM   
TOP 100 LIST Updated Jun 2, 2021

Many like to Buy the day before, near the Close, if the Money Wave is going to create a Buy Signal (Closing > 20 and out of the Green Zone).

Don’t Buy if the Investment has already popped up too much. Money Wave Buys are usually good for a 3-6 %  move in a few days.

We will “Not Log” trades if the Reward/Risk is not at least 2:1, or Low Volume. These have more risk.   

Related Post

– Money Wave Alert! Jun 18, 2021

Subscribe to Our Newsletter

AGL Logo

Get our eBook Now!

Candlestick - A Swing Traders Friend

We don’t spam! Read our privacy policy for more info.

You’ve been successfully subscribed to our newsletter!

Voted #1 at Stock Charts

SH Chart
Inverse S&P 500 Fund (SH) will have a Money Wave Buy today.

Help Us Help Animals

Help Us Help Animals

Recent Comments

  • Market Breadth Indicators: A Trader’s Guide to Early Trend Detection on Backtesting: Definition and How a Trading Strategy Backtest Works
  • Island Reversal Pattern: Definition and Formation Explained on Double Top Pattern: How to Identify and Trade This Reversal Signal
  • Channel Pattern Guide: What It Is and Why It Matters on A Guide to Forecasting Using Moving Averages
  • What Is a Broadening Bottom Chart Pattern? Full Guide on Bull vs. Bear Market: An Investor’s Guide to Market Phases
  • ATGL Weekly Money Flow - 2025-05-11 on ATGL Top Pick of the Week! Apr 6, 2025

Become a Green Liner!

Help me make more Money in the Stock Market.

ON ATGL

  • DashBoard
  • Weekly Commentary
  • Daily Buy / Sell Signals
  • Day Trade Setup
  • Trading Rooms

Design & Develop By Pixelvect

STRATEGIES

  • Swing Trading
  • ATGL Pick of the Week
  • Dividend Growth
  • ETF Sector Rotation
  • Dogs of the Dow

HELP

  • ATGL Trading Rules
  • FAQ
  • Account Maintenance
  • Contact US
  • Join

FOLLOW US

Instagram Linkedin Twitter Facebook

© COPYRIGHT 2024 · ABOVETHEGREENLINE.COM · ALL RIGHTS RESERVED · PRIVACY · TERMS · CONTACT · WATCHLIST · CURRENT