Above the Green Line -01
  • Market Insights
        • Commentary
          • Daily
          • Weekly
        • BUY / SELL SIGNALS
          • Trade Posts
          • Recent Trade Alerts
          • Recent Day Trades
        • BLOGROLL
          • Dividend Growth Blog
          • ETF Sector Blog
          • Dow Dogs
          • TPOW Blog
  • Strategies
        • SWING TRADING
          • Current Positions
          • Watchlists
          • Closed Positions
          • Candidates - TOP 100
          • Specialty Stocks
        • WEEKLY STOCK PICK
          • TPOW Charts
          • TPOW Performance
          • TPOW Strategy Guide
          • TPOW Performance Dashboard
        • DAY TRADING
          • Watch List
        • ATGL DASHBOARD
        • ETF STRATEGIES
          • ETF Sector Rotation
          • ETF Sector Portfolio
        • DIVIDEND GROWTH
          • Dividend Growth Portfolio
          • Dividend Calendar
        • DOGS OF THE DOW
          • Dogs of the Dow Portfolio
          • DOW 5 Portfolio
  • Markets
        • US MARKET
          • Commodities
          • Energy
          • Precious Metals
          • Volatility
        • GLOBAL MARKETS
          • Market Indices
          • Economic Calendar
          • FOREX Heat Map
          • FOREX Cross Rates
          • Crypto Currency Market
  • Investing
    • Discord Community
    • Dashboard
  • Resources
        • ARTICLES
          • Dividend Growth Model Articles
          • ETF Articles
          • Investment Strategies Articles
          • Market and Economic Insights
          • Stock Trade Articles
          • Stock Reviews
        • TOOLS
          • Stock Scanners
          • Charting Software
          • Brokerage Firms
        • STOCK CHARTS
          • Key Components
          • Reading Charts
          • Drawing Stock Charts
          • Identifying Trends
        • RETIREMENT PLANNING
  • About
    • Contact Us
    • How to Win
    • #1 At Stockcharts
    • Disclaimer
    • FAQ
  • Log In
  • Subscribe

June 15, 2018

Money Wave Alert! Jun 15, 2018

DIA Chart
DOW Index is near the Green Zone, but Low Relative Strength.


Markets were down today as some of  the Indices slipped below their Pink Lines (10-day avgs.) in the morning. The Strongest NASDAQ 100 and Small Cap Indices held up fine, to avoid Short Term Sell Signals.  

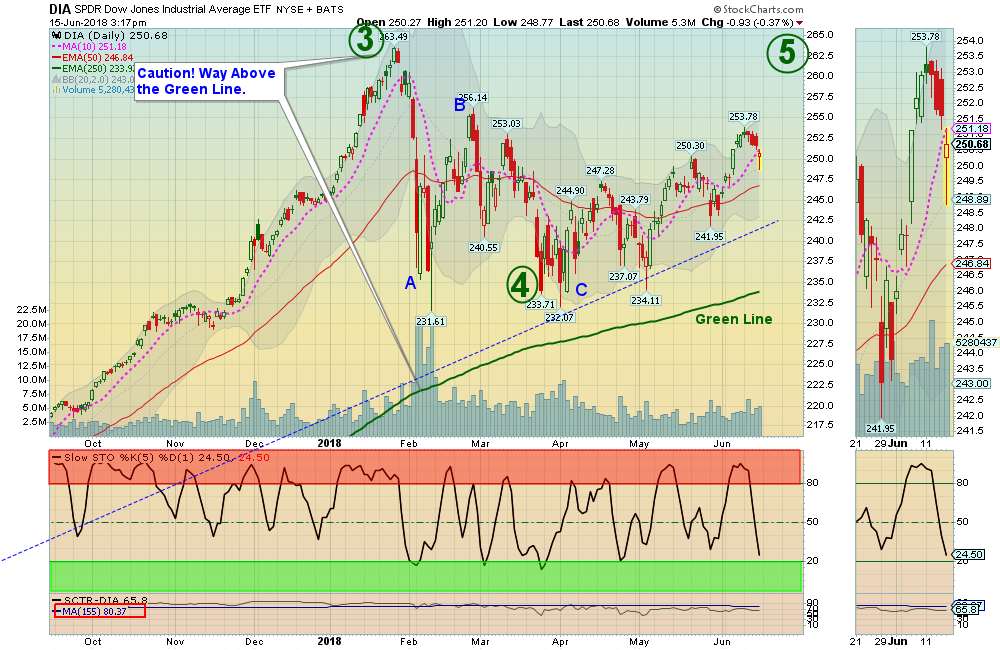
The big DOW Index is weaker, but is almost down to the Green Zone (Relative Strength is Below 90}.

The Leaders are still holding above their Pink Lines (10-day avgs.) to avoid Short Term Sell Signals.  


Crude Oil  was down today at $65.00 after Failing at the Red Line (50-day avg.)


Please be patient, and WAIT for the Leading Investments to return to the Green Zones for more Money Wave Buy Signals.

_____________________________________________________________________________________

The Following Investments will probably have a Money Wave Buy Signal soon.
(Slow Stochastic Closing > 20) on today’s Close.


BUYS TODAY    NONE TODAY


Money Wave Buys soon for:

DK    DELEK US HOLDINGS

DNR    DENBURY RESOURCES

KSS    KOHLS CORP.

M    MACY’S INC.    

WLL    WHITING PETE.


Please be patient and wait for Money Wave Buy Signals.  We will email you when they are ready. Click on Watch List.

Emotions are very high now, so please do not Buy unless you are VERY NIMBLE. The Leaders are still Way Above the Green Lines (all Investments eventually return to their Green Lines).

______________________________________________________________________________________

SELLS TODAY   


LOWER  the Sell Stop Loss on    USO    US OIL FUND    to $13.00 on the Close. Maybe it will have a “W” pattern back up soon.


EXIT    NIHD   NII HOLDINGS on the Close or have a tight Sell Stop Loss below it, if you bought it. NIHD is up 50% in two weeks.  This trade was not logged.


Please Check   PORTFOLIO  (Open Positions) and adjust your Sell Stops.

Click for  CLOSED POSITIONS.

Many like to Buy the day before, near the Close, if the Money Wave is going to create a Buy Signal (Closing > 20).

Don’t Buy if the Investment has already popped up too much. Money Wave Buys are usually good for a 3-6 %  move in a few days. We will “Not Log” trades if the Reward/Risk is not at least 2:1.

Related Post

– DK 

Subscribe to Our Newsletter

AGL Logo

Get our eBook Now!

Candlestick - A Swing Traders Friend

We don’t spam! Read our privacy policy for more info.

You’ve been successfully subscribed to our newsletter!

Voted #1 at Stock Charts

SH Chart
Inverse S&P 500 Fund (SH) will have a Money Wave Buy today.

Help Us Help Animals

Help Us Help Animals

Recent Comments

  • Market Breadth Indicators: A Trader’s Guide to Early Trend Detection on Backtesting: Definition and How a Trading Strategy Backtest Works
  • Island Reversal Pattern: Definition and Formation Explained on Double Top Pattern: How to Identify and Trade This Reversal Signal
  • Channel Pattern Guide: What It Is and Why It Matters on A Guide to Forecasting Using Moving Averages
  • What Is a Broadening Bottom Chart Pattern? Full Guide on Bull vs. Bear Market: An Investor’s Guide to Market Phases
  • ATGL Weekly Money Flow - 2025-05-11 on ATGL Top Pick of the Week! Apr 6, 2025

Become a Green Liner!

Help me make more Money in the Stock Market.

ON ATGL

  • DashBoard
  • Weekly Commentary
  • Daily Buy / Sell Signals
  • Day Trade Setup
  • Trading Rooms

Design & Develop By Pixelvect

STRATEGIES

  • Swing Trading
  • ATGL Pick of the Week
  • Dividend Growth
  • ETF Sector Rotation
  • Dogs of the Dow

HELP

  • ATGL Trading Rules
  • FAQ
  • Account Maintenance
  • Contact US
  • Join

FOLLOW US

Instagram Linkedin Twitter Facebook

© COPYRIGHT 2024 · ABOVETHEGREENLINE.COM · ALL RIGHTS RESERVED · PRIVACY · TERMS · CONTACT · WATCHLIST · CURRENT