Above the Green Line -01
  • Market Insights
        • Commentary
          • Daily
          • Weekly
        • BUY / SELL SIGNALS
          • Trade Posts
          • Recent Trade Alerts
          • Recent Day Trades
        • BLOGROLL
          • Dividend Growth Blog
          • ETF Sector Blog
          • Dow Dogs
          • TPOW Blog
  • Strategies
        • SWING TRADING
          • Current Positions
          • Watchlists
          • Closed Positions
          • Candidates - TOP 100
          • Specialty Stocks
        • WEEKLY STOCK PICK
          • TPOW Charts
          • TPOW Performance
          • TPOW Strategy Guide
          • TPOW Performance Dashboard
        • DAY TRADING
          • Watch List
        • ATGL DASHBOARD
        • ETF STRATEGIES
          • ETF Sector Rotation
          • ETF Sector Portfolio
        • DIVIDEND GROWTH
          • Dividend Growth Portfolio
          • Dividend Calendar
        • DOGS OF THE DOW
          • Dogs of the Dow Portfolio
          • DOW 5 Portfolio
  • Markets
        • US MARKET
          • Commodities
          • Energy
          • Precious Metals
          • Volatility
        • GLOBAL MARKETS
          • Market Indices
          • Economic Calendar
          • FOREX Heat Map
          • FOREX Cross Rates
          • Crypto Currency Market
  • Investing
    • Discord Community
    • Dashboard
  • Resources
        • ARTICLES
          • Dividend Growth Model Articles
          • ETF Articles
          • Investment Strategies Articles
          • Market and Economic Insights
          • Stock Trade Articles
          • Stock Reviews
        • TOOLS
          • Stock Scanners
          • Charting Software
          • Brokerage Firms
        • STOCK CHARTS
          • Key Components
          • Reading Charts
          • Drawing Stock Charts
          • Identifying Trends
        • RETIREMENT PLANNING
  • About
    • Contact Us
    • How to Win
    • #1 At Stockcharts
    • Disclaimer
    • FAQ
  • Log In
  • Subscribe

July 22, 2021

Money Wave Alert! Jul 22, 2021

QQQ Chart
The NASDAQ 100 Fund (QQQ) is quickly back up near resistance.

Markets were slightly higher again today as the Indices try to exceed the recent Highs. Let’s see: Markets are going down quickly on High Volume, and rally back up slower on Low Volume. Normally that is Bearish, but most don’t care with the FED Printing and creating a Bubble. This is NOT a normal Market, and most of you will remember this Virus stampede for the rest of your life.

The Markets are near Highs, but yesterday only 51 % of the S&P 500 Stocks were above their 50-day averages. In a good strong Market, “All Boats Rise”.

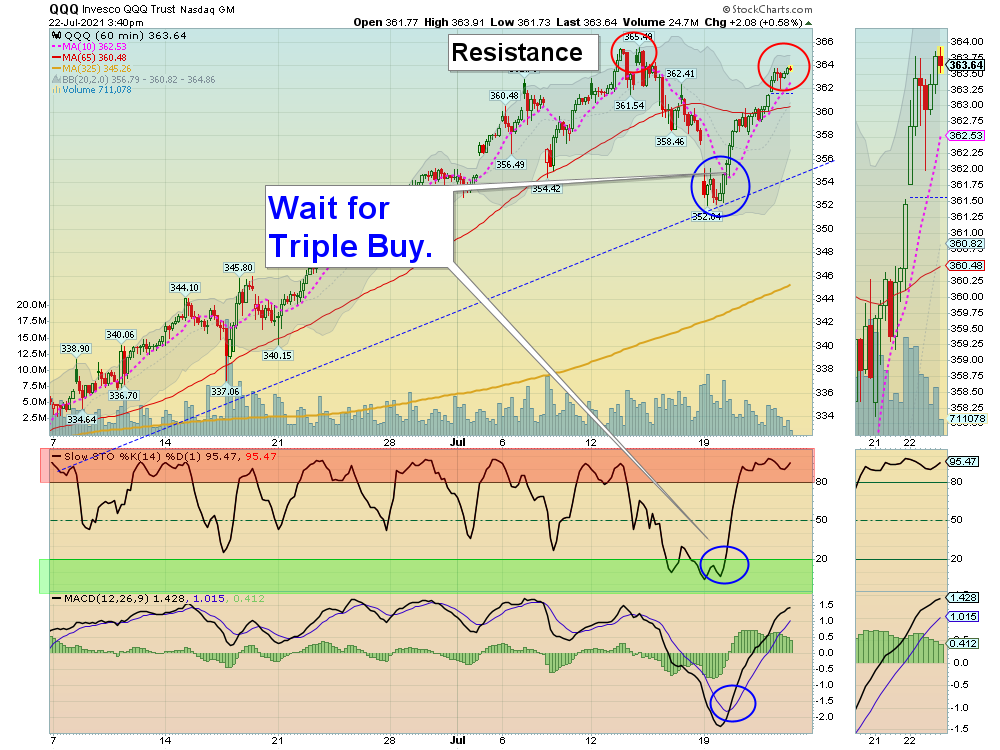
NEW SUBSCRIBERS:  The Markets finally pulled back to the 50-day averages on Monday, but the pull back was so tiny that the rally up has been small also. Many newer Investors are spending ALL of their Money up here, because of FOMO (FEAR OF MISSING OUT). The better trades happen when the S&P 500 Index is also in the Green Zone (now almost back up in the Red Zone again). 

Slow day on DAY TRADING SETUPS

Bonds  were up today, and are back above the Green Line.

Crude Oil was up $1.42 today at $71.72. 

BUYS TODAY    7/22/2021   NONE TODAY

_______________________________________________________________________________________________________

JUMP START SCROLLING CHARTS: (Buy Signal should be very soon… Click on the Jump Start link for more info.)    

ATOS      ATOSSA GENETICS      Wait for Money Wave Close > 20 with High Volume.  

LEDS      SEMILEDS CORP.    Buy above $10.90 with High Volume with a 5% Trailing Sell Stop Loss below it.

MMAT      META MATERIALS INC.    Buy above $4.24 with High Volume with a 5% Trailing Sell Stop Loss below it.     

____________________________________________________________________________________________________________

WATCH LIST

WATCH LIST SCROLLING CHARTS (Real Time)                

AUUD      AUDDIA INC.    Buy above $4.03 with High Volume with a 5% Trailing Sell Stop Loss below it.   

BB      BLACKBERRY LTD.     Buy above $10.90 with High Volume with a 5% Trailing Sell Stop Loss below it.       

MRIN      MARIN SOFTWARE INC.      Buy above the Pink Line with High Volume with a 5% Trailing Sell Stop Loss below it.

NEGG      NEWEGG COMMERCE      Buy above $30.99 with High Volume with a 5% Trailing Sell Stop Loss below it.  


Please be patient and wait for Money Wave Buy Signals.  We will email you when they are ready. Follow on the WATCH LIST.
Emotions are very high now, so please do not Buy unless you are VERY NIMBLE.

The Leaders are Way Above the Green Lines (all Investments eventually return to their Green Lines).      

____________________________________________________________________________________________________________

SELLS TODAY    

AMC      AMC ENTERTAINMENT      Slipped below the Buy Price yesterday and was Stopped Out (Don’t Take a Loss!). This trade was not logged.

Click for  CURRENT POSITION CHARTS – Real Time  (Please check and adjust your Sell Stops).        
Click for  CLOSED POSITIONS,   
NEW:       MY TRADING DASHBOARDDAY TRADING SETUPS
NEW:  TRADE ALERTS
ARE YOUR INVESTMENTS ABOVE THE GREEN LINE?
ETF SECTOR ROTATION SYSTEM   
TOP 100 LIST Updated Jul 5, 2021

Many like to Buy the day before, near the Close, if the Money Wave is going to create a Buy Signal (Closing > 20 and out of the Green Zone).

Don’t Buy if the Investment has already popped up too much. Money Wave Buys are usually good for a 3-6 %  move in a few days.

We will “Not Log” trades if the Reward/Risk is not at least 2:1, or Low Volume. These have more risk.     

Related Post

– Money Wave Alert! Jul 21, 2021

Subscribe to Our Newsletter

AGL Logo

Get our eBook Now!

Candlestick - A Swing Traders Friend

We don’t spam! Read our privacy policy for more info.

You’ve been successfully subscribed to our newsletter!

Voted #1 at Stock Charts

SH Chart
Inverse S&P 500 Fund (SH) will have a Money Wave Buy today.

Help Us Help Animals

Help Us Help Animals

Recent Comments

  • Market Breadth Indicators: A Trader’s Guide to Early Trend Detection on Backtesting: Definition and How a Trading Strategy Backtest Works
  • Island Reversal Pattern: Definition and Formation Explained on Double Top Pattern: How to Identify and Trade This Reversal Signal
  • Channel Pattern Guide: What It Is and Why It Matters on A Guide to Forecasting Using Moving Averages
  • What Is a Broadening Bottom Chart Pattern? Full Guide on Bull vs. Bear Market: An Investor’s Guide to Market Phases
  • ATGL Weekly Money Flow - 2025-05-11 on ATGL Top Pick of the Week! Apr 6, 2025

Become a Green Liner!

Help me make more Money in the Stock Market.

ON ATGL

  • DashBoard
  • Weekly Commentary
  • Daily Buy / Sell Signals
  • Day Trade Setup
  • Trading Rooms

Design & Develop By Pixelvect

STRATEGIES

  • Swing Trading
  • ATGL Pick of the Week
  • Dividend Growth
  • ETF Sector Rotation
  • Dogs of the Dow

HELP

  • ATGL Trading Rules
  • FAQ
  • Account Maintenance
  • Contact US
  • Join

FOLLOW US

Instagram Linkedin Twitter Facebook

© COPYRIGHT 2024 · ABOVETHEGREENLINE.COM · ALL RIGHTS RESERVED · PRIVACY · TERMS · CONTACT · WATCHLIST · CURRENT