Above the Green Line -01
  • Market Insights
        • Commentary
          • Daily
          • Weekly
        • BUY / SELL SIGNALS
          • Trade Posts
          • Recent Trade Alerts
          • Recent Day Trades
        • BLOGROLL
          • Dividend Growth Blog
          • ETF Sector Blog
          • Dow Dogs
          • TPOW Blog
  • Strategies
        • SWING TRADING
          • Current Positions
          • Watchlists
          • Closed Positions
          • Candidates - TOP 100
          • Specialty Stocks
        • WEEKLY STOCK PICK
          • TPOW Charts
          • TPOW Performance
          • TPOW Strategy Guide
          • TPOW Performance Dashboard
          • Why Weekly Trading Works
        • DAY TRADING
          • Watch List
        • ATGL DASHBOARD
        • ETF STRATEGIES
          • ETF Sector Rotation
          • ETF Sector Portfolio
        • DIVIDEND GROWTH
          • Dividend Growth Portfolio
          • Dividend Calendar
        • DOGS OF THE DOW
          • Dogs of the Dow Portfolio
          • DOW 5 Portfolio
  • Markets
        • US MARKET
          • Commodities
          • Energy
          • Precious Metals
          • Volatility
        • GLOBAL MARKETS
          • Market Indices
          • Economic Calendar
          • FOREX Heat Map
          • FOREX Cross Rates
          • Crypto Currency Market
  • Investing
    • Discord Community
    • Dashboard
  • Resources
        • ARTICLES
          • Dividend Growth Model Articles
          • ETF Articles
          • Investment Strategies Articles
          • Market and Economic Insights
          • Stock Trade Articles
          • Stock Reviews
        • TOOLS
          • Stock Scanners
          • Charting Software
          • Brokerage Firms
        • STOCK CHARTS
          • Key Components
          • Reading Charts
          • Drawing Stock Charts
          • Identifying Trends
        • RETIREMENT PLANNING
  • About
    • Contact Us
    • How to Win
    • #1 At Stockcharts
    • Disclaimer
    • FAQ
  • Log In
  • Subscribe

January 30, 2019

Money Wave Alert! Jan 30, 2019

DIA Chart
The FED is not helping Investors!


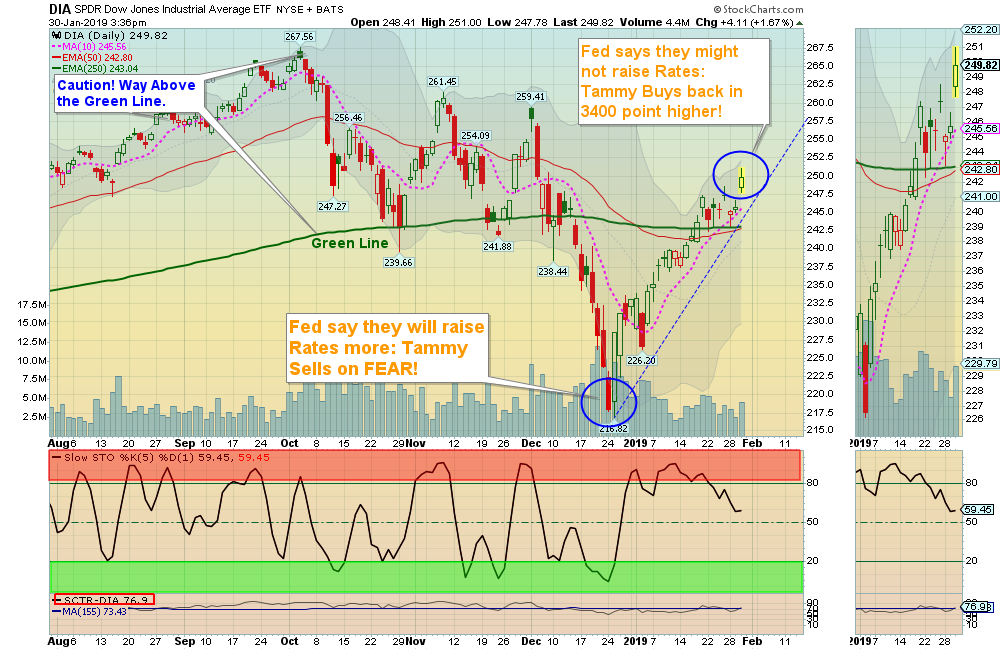
Last month the FED said they would be Raising Interest Rates more this year, and the DOW Index dumped to 21700 on FEAR SELLING. Now the FED says they might not Raise Rates any more soon, so Tammy piles back into the DOW Index at 25100 or 15% higher

Markets  were up big today on FED talk and better Earnings from AAPL & AMD. The DOW Index of 30 Companies has bounced nicely, but the S&P 500 is just now back up to the Green Line of 2688.

Investors are feeling much more confident lately, but remember that many stocks like Apple have not recovered very much at all.

Crude Oil  was up $0.90 today at  $54.20. 

__________________________________________________________________________________________________

The Following Investments will probably have a Money Wave Buy Signal soon.
(Slow Stochastic Closing > 20) on today’s Close.


BUYS TODAY    


DXCM    DEXCOM, INC.     Money Wave Buy today. DXCM will not be logged as the Volume is below average.

VHC      VIRNEX X HOLDING CO.     Money Wave Buy today. VHC will not be logged as it is already up 4.4% today.

We will “Not Log” trades if the Reward/Risk is not at least 2:1.


Money Wave Buys Signals Soon:             

LLY    ELI LILLY & CO.    Money Wave must Close in the Green Zone.

RWM    INVERSE SMALL CAP FUND     Medium Term Buy when it Closes above the Red Line (50-day avg.)   


Please be patient and wait for Money Wave Buy Signals.  We will email you when they are ready. Click on Watch List.

Emotions are very high now, so please do not Buy unless you are VERY NIMBLE. The Leaders are Way Above the Green Lines (all Investments eventually return to their Green Lines).

______________________________________________________________________________________

SELLS TODAY   


EXIT    AMD    ADVANCED MICRO    on the Close today, or have a tight Sell Stop below it to capture a 12% Gain (2nd Buy only).

EXIT    SH     S&P 500 INVERSE FUND if it is going to Close below Support of  $29.35.


LOWER the Sell Stop Loss on    UNG    US NAT”L. GAS FUND to $25.19.


Please Check   PORTFOLIO  (Open Positions) and adjust your Sell Stops.

Click for  CLOSED POSITIONS.


Many like to Buy the day before, near the Close, if the Money Wave is going to create a Buy Signal (Closing > 20).

Don’t Buy if the Investment has already popped up too much. Money Wave Buys are usually good for a 3-6 %  move in a few days.

We will “Not Log” trades if the Reward/Risk is not at least 2:1.

Related Post

– Money Wave Alert! Jan 29, 2019

Subscribe to Our Newsletter

AGL Logo

Get our eBook Now!

Candlestick - A Swing Traders Friend

We don’t spam! Read our privacy policy for more info.

You’ve been successfully subscribed to our newsletter!

Voted #1 at Stock Charts

SH Chart
Inverse S&P 500 Fund (SH) will have a Money Wave Buy today.

Help Us Help Animals

Help Us Help Animals

Recent Comments

  • Homepage on Systematic Risk: Definition, Types, and Examples
  • ATGL Weekly Money Flow - 2025-12-14 on ATGL Top Pick of the Week! Nov 30, 2025
  • TPOW: OKLO Gains 18% in Breakout Week – Top Pick of the Week (Dec 5, 2025) on Fibonacci Retracement: How To Use It for Support, Resistance, and Trade Entries
  • ATGL Weekly Money Flow - 2025-11-23 on Green Line Weekly Nov 16, 2025
  • ATGL Weekly Money Flow - 2025-11-16 on ATGL Top Pick of the Week! Nov 2, 2025

Become a Green Liner!

Help me make more Money in the Stock Market.

ON ATGL

  • DashBoard
  • Weekly Commentary
  • Daily Buy / Sell Signals
  • Day Trade Setup
  • Trading Rooms

Design & Develop By Pixelvect

STRATEGIES

  • Swing Trading
  • ATGL Pick of the Week
  • Dividend Growth
  • ETF Sector Rotation
  • Dogs of the Dow

HELP

  • ATGL Trading Rules
  • FAQ
  • Account Maintenance
  • Contact US
  • Join

FOLLOW US

Instagram Linkedin Twitter Facebook

© COPYRIGHT 2024 · ABOVETHEGREENLINE.COM · ALL RIGHTS RESERVED · PRIVACY · TERMS · CONTACT · WATCHLIST · CURRENT