Above the Green Line -01
  • Market Insights
        • Commentary
          • Daily
          • Weekly
        • BUY / SELL SIGNALS
          • Trade Posts
          • Recent Trade Alerts
          • Recent Day Trades
        • BLOGROLL
          • Dividend Growth Blog
          • ETF Sector Blog
          • Dow Dogs
          • TPOW Blog
  • Strategies
        • SWING TRADING
          • Current Positions
          • Watchlists
          • Closed Positions
          • Candidates - TOP 100
          • Specialty Stocks
        • WEEKLY STOCK PICK
          • TPOW Charts
          • TPOW Performance
          • TPOW Strategy Guide
          • TPOW Performance Dashboard
        • DAY TRADING
          • Watch List
        • ATGL DASHBOARD
        • ETF STRATEGIES
          • ETF Sector Rotation
          • ETF Sector Portfolio
        • DIVIDEND GROWTH
          • Dividend Growth Portfolio
          • Dividend Calendar
        • DOGS OF THE DOW
          • Dogs of the Dow Portfolio
          • DOW 5 Portfolio
  • Markets
        • US MARKET
          • Commodities
          • Energy
          • Precious Metals
          • Volatility
        • GLOBAL MARKETS
          • Market Indices
          • Economic Calendar
          • FOREX Heat Map
          • FOREX Cross Rates
          • Crypto Currency Market
  • Investing
    • Discord Community
    • Dashboard
  • Resources
        • ARTICLES
          • Dividend Growth Model Articles
          • ETF Articles
          • Investment Strategies Articles
          • Market and Economic Insights
          • Stock Trade Articles
          • Stock Reviews
        • TOOLS
          • Stock Scanners
          • Charting Software
          • Brokerage Firms
        • STOCK CHARTS
          • Key Components
          • Reading Charts
          • Drawing Stock Charts
          • Identifying Trends
        • RETIREMENT PLANNING
  • About
    • Contact Us
    • How to Win
    • #1 At Stockcharts
    • Disclaimer
    • FAQ
  • Log In
  • Subscribe

January 11, 2022

Money Wave Alert! Jan 11, 2022

SMH Chart
Money Wave Buy Signal today on the Semiconductor Fund (SMH).

Markets were higher today as many Leaders popped up out of the Green Zones for Money Wave Buy Signals. But the Buying Volume was disappointing and lower on most Investments today. The Indices were very over-sold for the Short Term. Maybe once more down in the morning and the Volume will pick up. Many investors are reluctant to Buy with the FED no longer helping with Printing…

The Financials and Energy Stocks are currently very strong, and will hardly come down at all. Try to put new Money into the Leaders below that are able to Hold above the Red Lines (50-day avgs.). 

New Subscribers: The Leaders are popping up out of the Green Zones for Buy Signals today. We like to Buy on increasing Volume, but that is not happening. Where are the Buyers? We are being cautious at this time. Money Wave pops works best when the S&P 500 Index is also in the Green Zone (like NOW!)

_________________________________________________________________________________________________________________

BUYS TODAY    1/11/2022    

AMD      ADVANCED MICRO      Money Wave Buy today. Target is $155. EXIT if it is going to Close below $125.03.   

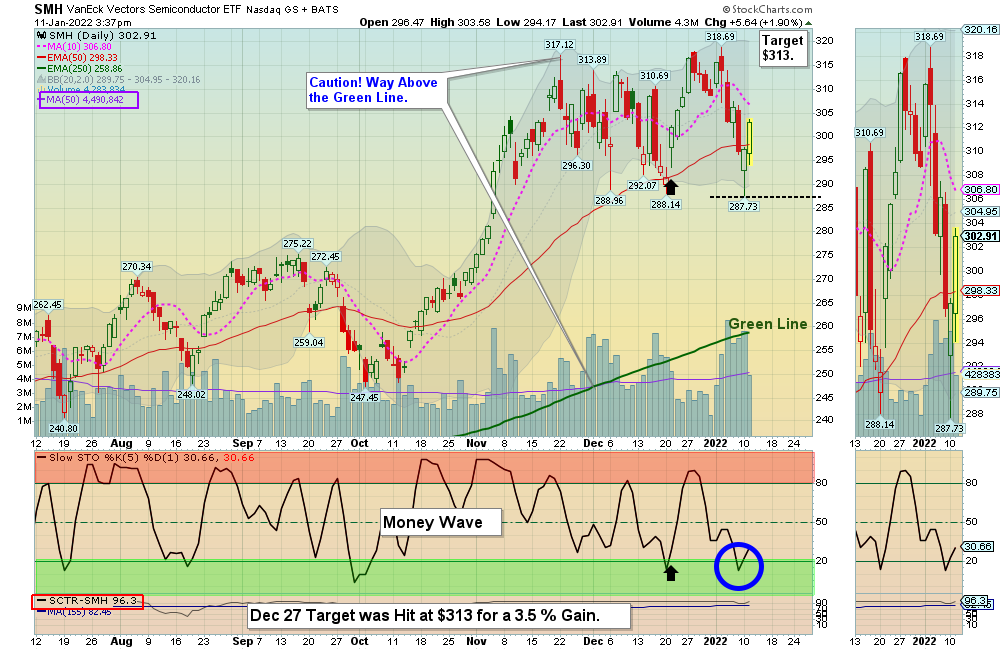
SMH      SEMICONDUCTOR FUND      Money Wave Buy today. Target is $313. EXIT if it is going to Close below $287.73.   


AAPL      APPLE INC.     Money Wave Buy today, but AAPL will not be Bought or Logged as the Volume is below average of 95.6 MIL. Maybe soon around $170.

ANET      ARISTA NETWORKS     Money Wave Buy today, but ANET will not be Bought or Logged as the Volume is below average of 2.4 MIL.  Maybe soon around $129.

PSTG      PURE STORAGE INC.      Money Wave Buy today, but PSTG will not be Bought or Logged as the Volume is below average of 3.9 MIL.  

TSLA      TESLA INC.      Money Wave Buy today, but TSLA will not be Bought or Logged as the Volume is below average of 27 MIL.  Maybe soon around $1015.

We will “Not Log” trades if the Reward/Risk is not at least 2:1, or Low Volume. These have more risk.   

BUYS TOMORROW – JUMP START STOCKS  Shop for a better price earlier in the day. Only use Jump Start on the same day that a Daily Money Wave Buy Signal will occur.     

PFE      PFIZER INC.      Trying to get above $56.44, but the Volume is not High (1/2 of normal).

BUYS SOON – CHARTS      WATCH LIST

UPST      UPSTART HOLDINGS      Buy above the Green Line of $157.10 with High Volume. (2nd Buy Signal soon).   

Please be patient and wait for Money Wave Buy Signals.  We will email you when they are ready. Follow on the WATCH LIST.      
The Leaders are Way Above the Green Lines (all Investments eventually return to their Green Lines).    LCID   LUCID GROUP    

SELLS TODAY           

LCID   LUCID GROUP       EXIT below your Buy Price, or $44.86 (Don’t Take a Loss!)

_________________________________________________________________________________________________________________

DAY TRADING SETUPS.  Several Triple Buy Pops today: ISPC (+5%)  ISIG (+13%) LVGN (+6%) LCID (+7%) PHUN (+6%) RBLX (+5%) & VIX (+5%) . Try out the New Side by Side layout.   

NEW! DAY TRADING FOR INDICES & LARGE CAPS. 

Bonds  were up again today, but are back Below the Green Line.      

Crude Oil was up $3.20 today at $81.43.

_________________________________________________________________________________________________________________

MY TRADING DASHBOARD 
SWING TRADING CURRENT POSITIONS
DAY TRADING SETUPS
TRADE ALERTS
ARE YOUR INVESTMENTS ABOVE THE GREEN LINE?
GREEN LINE RULES
ETF SECTOR ROTATION SYSTEM   
New TOP 100 LIST Updated Jan 1, 2022

Many like to Buy the Swing Trades just before the Close, if the Money Wave is going to create a Buy Signal (Closing > 20 and up out of the Green Zone).

Don’t Buy if the Investment has already popped up too much. Money Wave Buy Signals are usually good for a 3-6 %  move in a few days.

We will “Not Log” trades if the Reward/Risk is not at least 2:1, or Low Volume. These have more risk.   

Related Post

– AMD

Subscribe to Our Newsletter

AGL Logo

Get our eBook Now!

Candlestick - A Swing Traders Friend

We don’t spam! Read our privacy policy for more info.

You’ve been successfully subscribed to our newsletter!

Voted #1 at Stock Charts

SH Chart
Inverse S&P 500 Fund (SH) will have a Money Wave Buy today.

Help Us Help Animals

Help Us Help Animals

Recent Comments

  • Market Breadth Indicators: A Trader’s Guide to Early Trend Detection on Backtesting: Definition and How a Trading Strategy Backtest Works
  • Island Reversal Pattern: Definition and Formation Explained on Double Top Pattern: How to Identify and Trade This Reversal Signal
  • Channel Pattern Guide: What It Is and Why It Matters on A Guide to Forecasting Using Moving Averages
  • What Is a Broadening Bottom Chart Pattern? Full Guide on Bull vs. Bear Market: An Investor’s Guide to Market Phases
  • ATGL Weekly Money Flow - 2025-05-11 on ATGL Top Pick of the Week! Apr 6, 2025

Become a Green Liner!

Help me make more Money in the Stock Market.

ON ATGL

  • DashBoard
  • Weekly Commentary
  • Daily Buy / Sell Signals
  • Day Trade Setup
  • Trading Rooms

Design & Develop By Pixelvect

STRATEGIES

  • Swing Trading
  • ATGL Pick of the Week
  • Dividend Growth
  • ETF Sector Rotation
  • Dogs of the Dow

HELP

  • ATGL Trading Rules
  • FAQ
  • Account Maintenance
  • Contact US
  • Join

FOLLOW US

Instagram Linkedin Twitter Facebook

© COPYRIGHT 2024 · ABOVETHEGREENLINE.COM · ALL RIGHTS RESERVED · PRIVACY · TERMS · CONTACT · WATCHLIST · CURRENT