Above the Green Line -01
  • Market Insights
        • Commentary
          • Daily
          • Weekly
        • BUY / SELL SIGNALS
          • Trade Posts
          • Recent Trade Alerts
          • Recent Day Trades
        • BLOGROLL
          • Dividend Growth Blog
          • ETF Sector Blog
          • Dow Dogs
          • TPOW Blog
  • Strategies
        • SWING TRADING
          • Current Positions
          • Watchlists
          • Closed Positions
          • Candidates - TOP 100
          • Specialty Stocks
        • WEEKLY STOCK PICK
          • TPOW Charts
          • TPOW Performance
          • TPOW Strategy Guide
          • TPOW Performance Dashboard
        • DAY TRADING
          • Watch List
        • ATGL DASHBOARD
        • ETF STRATEGIES
          • ETF Sector Rotation
          • ETF Sector Portfolio
        • DIVIDEND GROWTH
          • Dividend Growth Portfolio
          • Dividend Calendar
        • DOGS OF THE DOW
          • Dogs of the Dow Portfolio
          • DOW 5 Portfolio
  • Markets
        • US MARKET
          • Commodities
          • Energy
          • Precious Metals
          • Volatility
        • GLOBAL MARKETS
          • Market Indices
          • Economic Calendar
          • FOREX Heat Map
          • FOREX Cross Rates
          • Crypto Currency Market
  • Investing
    • Discord Community
    • Dashboard
  • Resources
        • ARTICLES
          • Dividend Growth Model Articles
          • ETF Articles
          • Investment Strategies Articles
          • Market and Economic Insights
          • Stock Trade Articles
          • Stock Reviews
        • TOOLS
          • Stock Scanners
          • Charting Software
          • Brokerage Firms
        • STOCK CHARTS
          • Key Components
          • Reading Charts
          • Drawing Stock Charts
          • Identifying Trends
        • RETIREMENT PLANNING
  • About
    • Contact Us
    • How to Win
    • #1 At Stockcharts
    • Disclaimer
    • FAQ
  • Log In
  • Subscribe

February 18, 2020

Money Wave Alert! Feb 18, 2020

SPX Chart
The S&P 500 Index bounced up off the Pink Line.


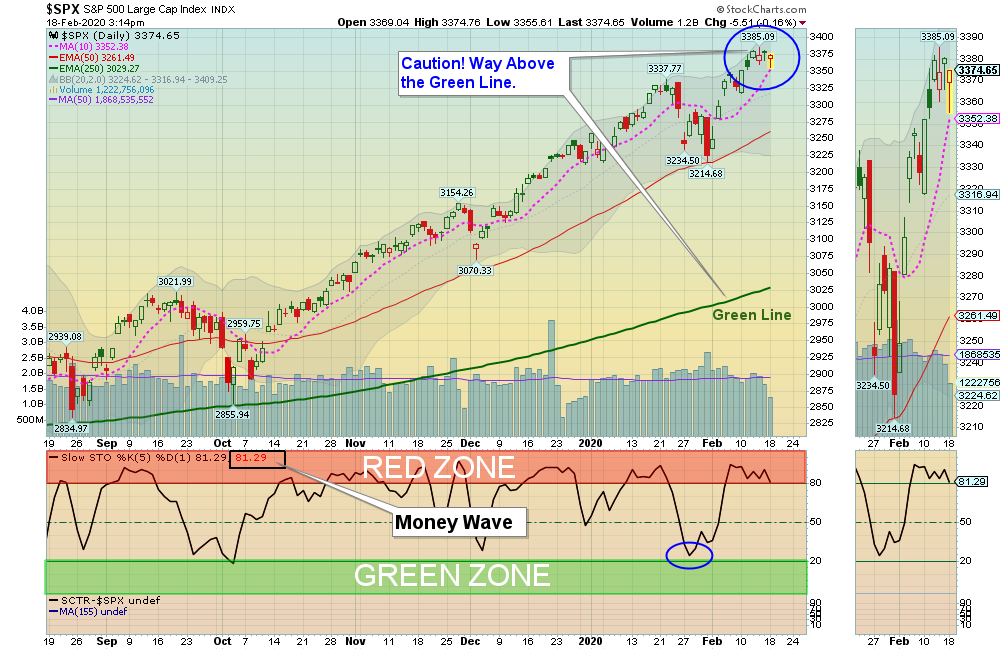
Markets were down again today as the Leaders and Indices were near Highs and over-bought for the Short Term. The S&P 500 Index went down near the Pink Line (10-day avg. ) of 3352 and bounced up to avoid a Short Term Sell Signal. The Semiconductors were weak today (please see Sell Signals below).

Most Leaders & Indices are currently back up near the Red Zones (probably too late to Buy for the Short Term). Please WAIT for these to return to their Green Zones for Money Wave Buy Signals. It does not take that long.

The best trades are when the S&P 500 Index is ALSO on the Green Zone, 

Bonds  were up again today. 

Crude Oil was down $0.03 today at $52.02.

______________________________________________________________________________________________________

The Following Investments will probably have a Money Wave Buy Signal soon. (Slow Stochastic Closing > 20) on today’s Close.

BUYS TODAY    2/18/2020   NONE TODAY


Money Wave Buys Signals Soon (Short Term):   (Best to Buy these when the S&P 500 is also in the Green Zone.)    

“JUMP START” Candidates:  (Buy Signal should be very soon… Click on the Jump Start link for more info.)

NONE TODAY

 ____________________________________________________________________________________________________________   

BX     BLACKSTONE GROUP       Money Wave must Close in the Green Zone.

LLY     ELI LILLY & CO.      Money Wave must Close in the Green Zone.

NK      NANTKWEST INC.     (Click link for info)

TRIL     TRILLIUM THERA.      Buy if it Closes Above $3.92 on High Volume.

TSG     THE STARS GROUP       Buy if it Closes Above $24.16 on High Volume.   


Please be patient and wait for Money Wave Buy Signals.  We will email you when they are ready. Click on Watch List.

Emotions are very high now, so please do not Buy unless you are VERY NIMBLE.

The Leaders are Way Above the Green Lines (all Investments eventually return to their Green Lines).

___________________________________________________________________________________________________

SELLS TODAY     


BMY     BRISTOL MEYERS      EXIT if it is going to Close below the Pink Line around $66.27.     


BLDP     BALLARD POWER SYSTEMS     is up 9.5% today and has met the Target of $12.00 for a 20% Gain. This trade was not logged.

INTC     INTEL CORP.      EXIT if it is going to Close below the Pink Line around $66.73.  This trade was not logged.     

MAXR     MAXAR TECH      EXIT if it is going to Close below the Pink Line around $17.85.  This trade was not logged.     

PLUG     PLUG POWER     is up 11% today and has met the Target of $5.00 for a 21% Gain. This trade was not logged.

SWKS     SKYWORKS SOLUTIONS    EXIT if it is going to Close below the Pink Line around $118.39.  This trade was not logged.     


Check   PORTFOLIO  (Open Positions) and adjust your Sell Stops. 

Click for  CLOSED POSITIONS, 

NEW! TOP 100 LIST Updated Jan 28, 2020

Many like to Buy the day before, near the Close, if the Money Wave is going to create a Buy Signal (Closing > 20 and out of the Green Zone).

Don’t Buy if the Investment has already popped up too much. Money Wave Buys are usually good for a 3-6 %  move in a few days.

We will “Not Log” trades if the Reward/Risk is not at least 2:1.

Related Post

– Money Wave Alert! Feb 14, 2020

Subscribe to Our Newsletter

AGL Logo

Get our eBook Now!

Candlestick - A Swing Traders Friend

We don’t spam! Read our privacy policy for more info.

You’ve been successfully subscribed to our newsletter!

Voted #1 at Stock Charts

SH Chart
Inverse S&P 500 Fund (SH) will have a Money Wave Buy today.

Help Us Help Animals

Help Us Help Animals

Recent Comments

  • Price Action Trading Strategies That Work in Any Market on What Is a Death Cross in Stocks? A Bearish Market Signal
  • ATGL Weekly Money Flow - 2025-07-13 on AGTL Top Pick of the Week! May 11, 2025
  • Market Breadth Indicators: A Trader’s Guide to Early Trend Detection on Backtesting: Definition and How a Trading Strategy Backtest Works
  • Island Reversal Pattern: Definition and Formation Explained on Double Top Pattern: How to Identify and Trade This Reversal Signal
  • Channel Pattern Guide: What It Is and Why It Matters on A Guide to Forecasting Using Moving Averages

Become a Green Liner!

Help me make more Money in the Stock Market.

ON ATGL

  • DashBoard
  • Weekly Commentary
  • Daily Buy / Sell Signals
  • Day Trade Setup
  • Trading Rooms

Design & Develop By Pixelvect

STRATEGIES

  • Swing Trading
  • ATGL Pick of the Week
  • Dividend Growth
  • ETF Sector Rotation
  • Dogs of the Dow

HELP

  • ATGL Trading Rules
  • FAQ
  • Account Maintenance
  • Contact US
  • Join

FOLLOW US

Instagram Linkedin Twitter Facebook

© COPYRIGHT 2024 · ABOVETHEGREENLINE.COM · ALL RIGHTS RESERVED · PRIVACY · TERMS · CONTACT · WATCHLIST · CURRENT