Above the Green Line -01
  • Market Insights
        • Commentary
          • Daily
          • Weekly
        • BUY / SELL SIGNALS
          • Trade Posts
          • Recent Trade Alerts
          • Recent Day Trades
        • BLOGROLL
          • Dividend Growth Blog
          • ETF Sector Blog
          • Dow Dogs
          • TPOW Blog
  • Strategies
        • SWING TRADING
          • Current Positions
          • Watchlists
          • Closed Positions
          • Candidates - TOP 100
          • Specialty Stocks
        • WEEKLY STOCK PICK
          • TPOW Charts
          • TPOW Performance
          • TPOW Strategy Guide
          • TPOW Performance Dashboard
        • DAY TRADING
          • Watch List
        • ATGL DASHBOARD
        • ETF STRATEGIES
          • ETF Sector Rotation
          • ETF Sector Portfolio
        • DIVIDEND GROWTH
          • Dividend Growth Portfolio
          • Dividend Calendar
        • DOGS OF THE DOW
          • Dogs of the Dow Portfolio
          • DOW 5 Portfolio
  • Markets
        • US MARKET
          • Commodities
          • Energy
          • Precious Metals
          • Volatility
        • GLOBAL MARKETS
          • Market Indices
          • Economic Calendar
          • FOREX Heat Map
          • FOREX Cross Rates
          • Crypto Currency Market
  • Investing
    • Discord Community
    • Dashboard
  • Resources
        • ARTICLES
          • Dividend Growth Model Articles
          • ETF Articles
          • Investment Strategies Articles
          • Market and Economic Insights
          • Stock Trade Articles
          • Stock Reviews
        • TOOLS
          • Stock Scanners
          • Charting Software
          • Brokerage Firms
        • STOCK CHARTS
          • Key Components
          • Reading Charts
          • Drawing Stock Charts
          • Identifying Trends
        • RETIREMENT PLANNING
  • About
    • Contact Us
    • How to Win
    • #1 At Stockcharts
    • Disclaimer
    • FAQ
  • Log In
  • Subscribe

August 4, 2020

Money Wave Alert! Aug 4, 2020

WIMI Chart
How to Capture fast movers with a Trailing Stop (like on WIMI today).

Markets were up today, as the Leaders were squirting higher.  The Leaders are mostly all up in the Red Zones (probably too late to Buy for the Short Term). The Volume is low again today, and S&P 500 Index needs to stay above the Pink Line (10-day avg.) of 3255, to remain Bullish.

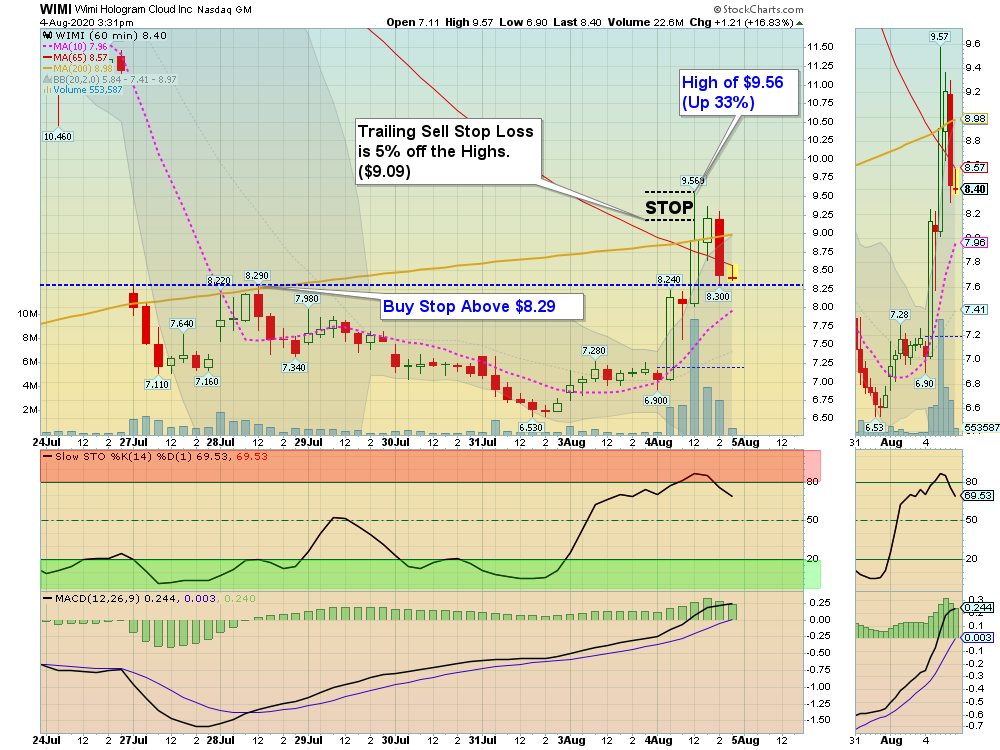
Since so many Money Wave Pops are going up more than 3% before the End of the Day Signal, we will be using Buy Stop Prices to avoid missing so many trades. With a Buy Stop, when the price exceeds the Buy amount, you should Enter. Then we will be following it up with a Trailing Sell Stop Loss. A Trailing Stop Loss moves up with the Price. For example, the Buy Stop Price on WIMI was set this morning above Resistance of $8.29. WIMI went as High as $9.57 (up 33%), so the Trailing Sell Stop would have been raised to $9.09, and Out with a quick gain. If you are not interested in this type of trade, then just consider it NOT LOGGED (up 17 %).

Please WAIT for the Leaders to return back down into the Green Zones for Money Wave Buy Signals. The better trades happen when the S&P 500 Index is also in the Green Zone. (Now the S&P 500 is back up in the Red Zone).

Please remember that the Markets are up 50% from the March Lows, and are over-bought from “Good News” Buyers. 

Bonds  were down today. 

Crude Oil was up $0.60 today at $41.61

BUYS TODAY    8/4/2020   

WIMI      WIMI HOLOGRAM CLOUD      Bought today above $8.29 today. High was $9.57 with a Trailing Sell Stop 5% lower. So Out at $9.08 with 9% Gain.


SHLL     TORTOISE ACQUISITION      This was bought yesterday too late above $19.88 with a Sell Stop Loss 5% below it. SHLL will not be logged.

We will “Not Log” trades if the Reward/Risk is not at least 2:1.   

“JUMP START” Candidates:  (Buy Signal should be very soon… Click on the Jump Start link for more info.)    

NONE TODAY

____________________________________________________________________________________________________________________________________________________  

WATCH LIST

Money Wave Buys Signals Soon (3 Days-3 Weeks Short Term):   (Best to Buy these when the S&P 500 is also in the Green Zone.)       

The Following Investments will probably have a Money Wave Buy Signal soon. (Slow Stochastic Closing > 20) on today’s Close.   

AU      ANGLOGOLD LTD.

KODK      EASTMAN KODAK

SPOT     SPOTIFY TECH SA     

UONE      URBAN ONE INC.      Buy above $16.50 with a Sell Stop Loss 3% below.     

VBIV    VBI VACCINES INC.     Buy above $4.68 with a Sell Stop Loss 5% below it.     

VXRT     VAXART INC.      (2nd Buy Signal soon).

XBI      BIOTECH FUND      Money Wave must Close in the Green Zone.

Please be patient and wait for Money Wave Buy Signals.  We will email you when they are ready. Follow on the WATCH LIST.

Emotions are very high now, so please do not Buy unless you are VERY NIMBLE.

The Leaders are Way Above the Green Lines (all Investments eventually return to their Green Lines).

___________________________________________________________________________________________________

SELLS TODAY   

GNUS      GENIUS BRANDS INT’l.    Bought yesterday above $1.74, and it went up to $2.00. EXIT if it is going to Close below $1.70 on the Close. 


DIGL     DIGITAL ALLY      EXIT if it is going to Close below your Buy Price, or $3.14.  This trade was not logged.

SPCE      VIRGIN GALACTIC HOLDINGS      EXIT if it is going to Close below Support of $21.91.  This trade was not logged.

Click for  CURRENT POSITIONS  and adjust your Sell Stops. 
Click for  CLOSED POSITIONS,   

NEW PENNY STOCK WATCH LIST
ARE YOUR INVESTMENTS ABOVE THE GREEN LINE?
ETF SECTOR ROTATION SYSTEM   
NEW TOP 100 LIST Updated Aug 4, 2020

Many like to Buy the day before, near the Close, if the Money Wave is going to create a Buy Signal (Closing > 20 and out of the Green Zone).

Don’t Buy if the Investment has already popped up too much. Money Wave Buys are usually good for a 3-6 %  move in a few days.

We will “Not Log” trades if the Reward/Risk is not at least 2:1.   

Related Post

– Money Wave Alert! Aug 3, 2020

Subscribe to Our Newsletter

AGL Logo

Get our eBook Now!

Candlestick - A Swing Traders Friend

We don’t spam! Read our privacy policy for more info.

You’ve been successfully subscribed to our newsletter!

Voted #1 at Stock Charts

SH Chart
Inverse S&P 500 Fund (SH) will have a Money Wave Buy today.

Help Us Help Animals

Help Us Help Animals

Recent Comments

  • Market Breadth Indicators: A Trader’s Guide to Early Trend Detection on Backtesting: Definition and How a Trading Strategy Backtest Works
  • Island Reversal Pattern: Definition and Formation Explained on Double Top Pattern: How to Identify and Trade This Reversal Signal
  • Channel Pattern Guide: What It Is and Why It Matters on A Guide to Forecasting Using Moving Averages
  • What Is a Broadening Bottom Chart Pattern? Full Guide on Bull vs. Bear Market: An Investor’s Guide to Market Phases
  • ATGL Weekly Money Flow - 2025-05-11 on ATGL Top Pick of the Week! Apr 6, 2025

Become a Green Liner!

Help me make more Money in the Stock Market.

ON ATGL

  • DashBoard
  • Weekly Commentary
  • Daily Buy / Sell Signals
  • Day Trade Setup
  • Trading Rooms

Design & Develop By Pixelvect

STRATEGIES

  • Swing Trading
  • ATGL Pick of the Week
  • Dividend Growth
  • ETF Sector Rotation
  • Dogs of the Dow

HELP

  • ATGL Trading Rules
  • FAQ
  • Account Maintenance
  • Contact US
  • Join

FOLLOW US

Instagram Linkedin Twitter Facebook

© COPYRIGHT 2024 · ABOVETHEGREENLINE.COM · ALL RIGHTS RESERVED · PRIVACY · TERMS · CONTACT · WATCHLIST · CURRENT