Above the Green Line -01
  • Market Insights
        • Commentary
          • Daily
          • Weekly
        • BUY / SELL SIGNALS
          • Trade Posts
          • Recent Trade Alerts
          • Recent Day Trades
        • BLOGROLL
          • Dividend Growth Blog
          • ETF Sector Blog
          • Dow Dogs
          • TPOW Blog
  • Strategies
        • SWING TRADING
          • Current Positions
          • Watchlists
          • Closed Positions
          • Candidates - TOP 100
          • Specialty Stocks
        • WEEKLY STOCK PICK
          • TPOW Charts
          • TPOW Performance
          • TPOW Strategy Guide
          • TPOW Performance Dashboard
        • DAY TRADING
          • Watch List
        • ATGL DASHBOARD
        • ETF STRATEGIES
          • ETF Sector Rotation
          • ETF Sector Portfolio
        • DIVIDEND GROWTH
          • Dividend Growth Portfolio
          • Dividend Calendar
        • DOGS OF THE DOW
          • Dogs of the Dow Portfolio
          • DOW 5 Portfolio
  • Markets
        • US MARKET
          • Commodities
          • Energy
          • Precious Metals
          • Volatility
        • GLOBAL MARKETS
          • Market Indices
          • Economic Calendar
          • FOREX Heat Map
          • FOREX Cross Rates
          • Crypto Currency Market
  • Investing
    • Discord Community
    • Dashboard
  • Resources
        • ARTICLES
          • Dividend Growth Model Articles
          • ETF Articles
          • Investment Strategies Articles
          • Market and Economic Insights
          • Stock Trade Articles
          • Stock Reviews
        • TOOLS
          • Stock Scanners
          • Charting Software
          • Brokerage Firms
        • STOCK CHARTS
          • Key Components
          • Reading Charts
          • Drawing Stock Charts
          • Identifying Trends
        • RETIREMENT PLANNING
  • About
    • Contact Us
    • How to Win
    • #1 At Stockcharts
    • Disclaimer
    • FAQ
  • Log In
  • Subscribe

April 17, 2020

Money Wave Alert! Apr 17, 2020

TNX Chart
The Interest Rate on the 10 year T-Note is still Low at 0.6%.


Markets “Gapped Up” today on hopeful News, but the Volume was low. The S&P 500 Index is back above the Red Line (50-day avg.) but the Buying was average. The Markets should hold up OK until they break the Pink Lines (10-day avgs.) Most of the Leaders are currently over-bought for the Short Term. All of the major Indices except the NASDAQ 100 are still Below the Green Lines, which is Bearish.

The Reward / Risk of Buying up here is not good now, so we are slowly taking profits. The weaker Indices like the Small Caps, Transports & NYSE could easily go back down once more. This rally from the Lows could be an A-B-C up on Elliott Wave count, and then maybe a “W” pattern back down again. Wait for the Leaders to return to their Green Zones (it does not take that long). The Watch List is very small… WAIT.

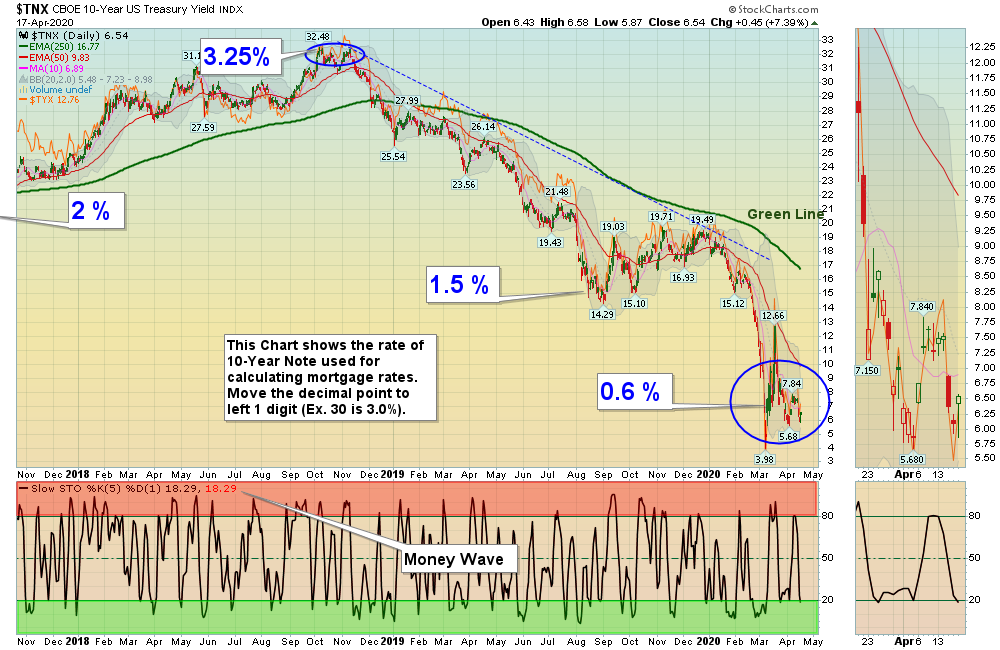
NEW SUBSCRIBERS:  Please realize that the DOW 30 Index has just rallied up 5800 points (or 30% from the March Lows) and is still Below the Green Line.  That is NOT GOOD. The Green Line System has captured many nice trades from the recent Lows, but now we have to WAIT. Be patient and WAIT for the S&P 500 Index to come back down from the Red Zone and return to the Green Zone for more Money Wave Buys. 


Bonds  were down today after Stocks rose.  

Crude Oil was down $1.81 today at $18.06, a New Low.


The Following Investments will probably have a Money Wave Buy Signal soon. (Slow Stochastic Closing > 20) on today’s Close.

BUYS TODAY    4/17/2020    NONE TODAY


Money Wave Buys Signals Soon (Short Term):   (Best to Buy these when the S&P 500 is also in the Green Zone.)    


“JUMP START” Candidates:  (Buy Signal should be very soon… Click on the Jump Start link for more info.)   

ATHX      ATHERSYS INC.

_______________________________________________________________________________________________________________________________________________  

UIS     UNISYS CORP.

VXX     VOLATILITY FUND       Buy if it Closes above $43.72 on High Volume.


Please be patient and wait for Money Wave Buy Signals.  We will email you when they are ready. Click on Watch List.

Emotions are very high now, so please do not Buy unless you are VERY NIMBLE.

The Leaders are Way Above the Green Lines (all Investments eventually return to their Green Lines).

___________________________________________________________________________________________________

SELLS TODAY   


PLUG     PLUG POWER INC.     EXIT on the Close today, or have a tight Sell Stop Loss below it. We bought the first position too early, and it has rallied 45 % from the April Lows.  Need to get in sync with the cycles.


TLT      US GOV’T BOND FUND     EXIT if it is going to Close below your Buy Price, or $168.18.  This trade was not logged.


Click for   PORTFOLIO  (Open Positions) and adjust your Sell Stops. 

Click for  CLOSED POSITIONS, 

NEW ETF SECTOR ROTATION SYSTEM   (LINK)

NEW! TOP 100 LIST Updated Mar 31, 2020


Many like to Buy the day before, near the Close, if the Money Wave is going to create a Buy Signal (Closing > 20 and out of the Green Zone).

Don’t Buy if the Investment has already popped up too much. Money Wave Buys are usually good for a 3-6 %  move in a few days.

We will “Not Log” trades if the Reward/Risk is not at least 2:1.


HAVE A SAFE WEEKEND!

Related Post

– Money Wave Alert! Apr 16, 2020

Subscribe to Our Newsletter

AGL Logo

Get our eBook Now!

Candlestick - A Swing Traders Friend

We don’t spam! Read our privacy policy for more info.

You’ve been successfully subscribed to our newsletter!

Voted #1 at Stock Charts

SH Chart
Inverse S&P 500 Fund (SH) will have a Money Wave Buy today.

Help Us Help Animals

Help Us Help Animals

Recent Comments

  • Market Breadth Indicators: A Trader’s Guide to Early Trend Detection on Backtesting: Definition and How a Trading Strategy Backtest Works
  • Island Reversal Pattern: Definition and Formation Explained on Double Top Pattern: How to Identify and Trade This Reversal Signal
  • Channel Pattern Guide: What It Is and Why It Matters on A Guide to Forecasting Using Moving Averages
  • What Is a Broadening Bottom Chart Pattern? Full Guide on Bull vs. Bear Market: An Investor’s Guide to Market Phases
  • ATGL Weekly Money Flow - 2025-05-11 on ATGL Top Pick of the Week! Apr 6, 2025

Become a Green Liner!

Help me make more Money in the Stock Market.

ON ATGL

  • DashBoard
  • Weekly Commentary
  • Daily Buy / Sell Signals
  • Day Trade Setup
  • Trading Rooms

Design & Develop By Pixelvect

STRATEGIES

  • Swing Trading
  • ATGL Pick of the Week
  • Dividend Growth
  • ETF Sector Rotation
  • Dogs of the Dow

HELP

  • ATGL Trading Rules
  • FAQ
  • Account Maintenance
  • Contact US
  • Join

FOLLOW US

Instagram Linkedin Twitter Facebook

© COPYRIGHT 2024 · ABOVETHEGREENLINE.COM · ALL RIGHTS RESERVED · PRIVACY · TERMS · CONTACT · WATCHLIST · CURRENT