Above the Green Line -01
  • Market Insights
        • Commentary
          • Daily
          • Weekly
        • BUY / SELL SIGNALS
          • Trade Posts
          • Recent Trade Alerts
          • Recent Day Trades
        • BLOGROLL
          • Dividend Growth Blog
          • ETF Sector Blog
          • Dow Dogs
          • TPOW Blog
  • Strategies
        • SWING TRADING
          • Current Positions
          • Watchlists
          • Closed Positions
          • Candidates - TOP 100
          • Specialty Stocks
        • WEEKLY STOCK PICK
          • TPOW Charts
          • TPOW Performance
          • TPOW Strategy Guide
          • TPOW Performance Dashboard
        • DAY TRADING
          • Watch List
        • ATGL DASHBOARD
        • ETF STRATEGIES
          • ETF Sector Rotation
          • ETF Sector Portfolio
        • DIVIDEND GROWTH
          • Dividend Growth Portfolio
          • Dividend Calendar
        • DOGS OF THE DOW
          • Dogs of the Dow Portfolio
          • DOW 5 Portfolio
  • Markets
        • US MARKET
          • Commodities
          • Energy
          • Precious Metals
          • Volatility
        • GLOBAL MARKETS
          • Market Indices
          • Economic Calendar
          • FOREX Heat Map
          • FOREX Cross Rates
          • Crypto Currency Market
  • Investing
    • Discord Community
    • Dashboard
  • Resources
        • ARTICLES
          • Dividend Growth Model Articles
          • ETF Articles
          • Investment Strategies Articles
          • Market and Economic Insights
          • Stock Trade Articles
          • Stock Reviews
        • TOOLS
          • Stock Scanners
          • Charting Software
          • Brokerage Firms
        • STOCK CHARTS
          • Key Components
          • Reading Charts
          • Drawing Stock Charts
          • Identifying Trends
        • RETIREMENT PLANNING
  • About
    • Contact Us
    • How to Win
    • #1 At Stockcharts
    • Disclaimer
    • FAQ
  • Log In
  • Subscribe

April 12, 2022

Money Wave Alert! Apr 12, 2022

TYX Chart
The Yield on the T-Bond needs to Double Top here for Long Interest Rates to come down.

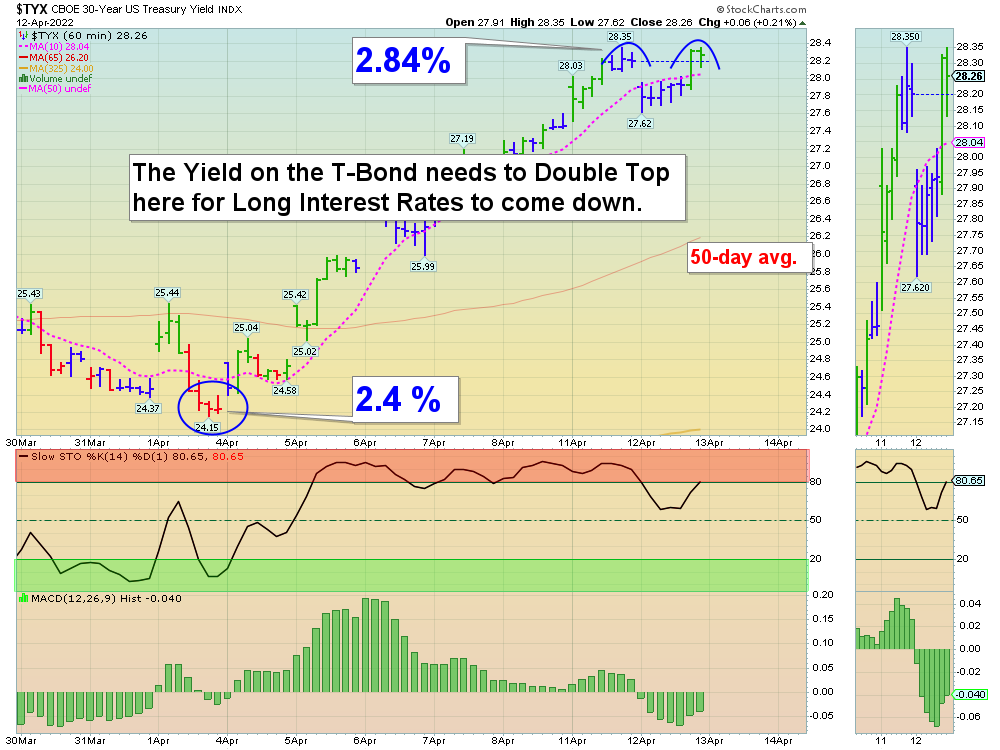
Markets were slightly lower again today after a rally in the morning. The longer term Interest Rates are re-testing yesterday’s High. A Double Top here on long term Interest Rates could also be a Double Bottom on the Long Term T-Bonds,  which look like they are having a Selling Climax. Tammy is dumping Bonds (Way Below the Green Line). on FEAR, but we know that FEAR is temporary and Bonds will eventually return back up near the Green Line.

Higher Interest Rates has also caused dumping the Big Tech and NASDAQ 100 Funds. Historically high Commodity prices and Interest Rates will slow down the Economy. This would normally cause long term Interest Rates to drop, and maybe a pop up on the Tech Stocks.

The S&P 500 Index back down in the Green Zone (probably too late to Sell for the Short Term) and we have plenty of Cash for more Money Wave Buy Signals soon.

New Subscribers:  Now some of the strongest Stocks have come down near the Green Zones more Money Wave Buy Signals soon.  BUYS SOON – CHARTS  The best moves are when the S&P 500 Index is also coming up out of the Green Zone. (Now in the Green Zone).

BUYS TODAY    4/12/2022    NONE TODAY    


BUYS TOMORROW – JUMP START STOCKS  Shop for a better price earlier in the day. Only use Jump Start on the same day that a Daily Money Wave Buy Signal will occur.   

AA      ALCOA CORP.      Wait for Money Wave Close > 20 with High Volume.    

EWW      MEXICO FUND      Wait for Money Wave Close > 20 with High Volume.  

BUYS SOON – CHARTS      WATCH LIST

NVDA      NVIDIA CORP.      Wait for Money Wave Close > 20 with High Volume.  

TSLA      TSLA INC.      Wait for Money Wave Close > 20 with High Volume.     

X      US STEEL GROUP      Money Wave must Close in the Green Zone.   

XLK      TECH FUND      Wait for Money Wave Close > 20 with High Volume.  

ZIM      ZIM INTEGRATED SHIPPING      Wait for Money Wave Close > 20 with High Volume. 

Please be patient and wait for Money Wave Buy Signals.  We will email you when they are ready. Follow on the WATCH LIST.      
The Leaders are Way Above the Green Lines (all Investments eventually return to their Green Lines).   AMD      ADVANCED MICRO

SELLS TODAY       

AMD      ADVANCED MICRO     LOWER the Sell Stop Loss below $90.00 until it bottoms. Money Wave is in the Green Zone.     

____________________________________________________________________________________________________________________

DAY TRADING SETUPS.  Several Triple Buy Pops today: HUSA (+15%) MARA (+5%) PHUN (+6%) SOXL (+8%) TQQQ (+6%) & USO (+6%). Try out the New Side by Side layout.   

DAY TRADING FOR INDICES & LARGE CAPS CHARTS.

Bonds  were down again today, and are Below the Green Line. 

Crude Oil was up $6.19 today at $100.48.     _________________________________________________________________________________________________________________

MY TRADING DASHBOARD 
SWING TRADING CURRENT POSITIONS
DAY TRADING SETUPS
TRADE ALERTS
ARE YOUR INVESTMENTS ABOVE THE GREEN LINE?
GREEN LINE RULES
ETF SECTOR ROTATION SYSTEM   
New TOP 100 LIST Updated Apr 2, 2022

Many like to Buy the Swing Trades just before the Close, if the Money Wave is going to create a Buy Signal (Closing > 20 and up out of the Green Zone).

Don’t Buy if the Investment has already popped up too much. Money Wave Buy Signals are usually good for a 3-6 %  move in a few days.

We will “Not Log” trades if the Reward/Risk is not at least 2:1, or Low Volume. These have more risk.   

Related Post

– AA

Subscribe to Our Newsletter

AGL Logo

Get our eBook Now!

Candlestick - A Swing Traders Friend

We don’t spam! Read our privacy policy for more info.

You’ve been successfully subscribed to our newsletter!

Voted #1 at Stock Charts

SH Chart
Inverse S&P 500 Fund (SH) will have a Money Wave Buy today.

Help Us Help Animals

Help Us Help Animals

Recent Comments

  • Market Breadth Indicators: A Trader’s Guide to Early Trend Detection on Backtesting: Definition and How a Trading Strategy Backtest Works
  • Island Reversal Pattern: Definition and Formation Explained on Double Top Pattern: How to Identify and Trade This Reversal Signal
  • Channel Pattern Guide: What It Is and Why It Matters on A Guide to Forecasting Using Moving Averages
  • What Is a Broadening Bottom Chart Pattern? Full Guide on Bull vs. Bear Market: An Investor’s Guide to Market Phases
  • ATGL Weekly Money Flow - 2025-05-11 on ATGL Top Pick of the Week! Apr 6, 2025

Become a Green Liner!

Help me make more Money in the Stock Market.

ON ATGL

  • DashBoard
  • Weekly Commentary
  • Daily Buy / Sell Signals
  • Day Trade Setup
  • Trading Rooms

Design & Develop By Pixelvect

STRATEGIES

  • Swing Trading
  • ATGL Pick of the Week
  • Dividend Growth
  • ETF Sector Rotation
  • Dogs of the Dow

HELP

  • ATGL Trading Rules
  • FAQ
  • Account Maintenance
  • Contact US
  • Join

FOLLOW US

Instagram Linkedin Twitter Facebook

© COPYRIGHT 2024 · ABOVETHEGREENLINE.COM · ALL RIGHTS RESERVED · PRIVACY · TERMS · CONTACT · WATCHLIST · CURRENT