By ATGL
Updated October 21, 2025
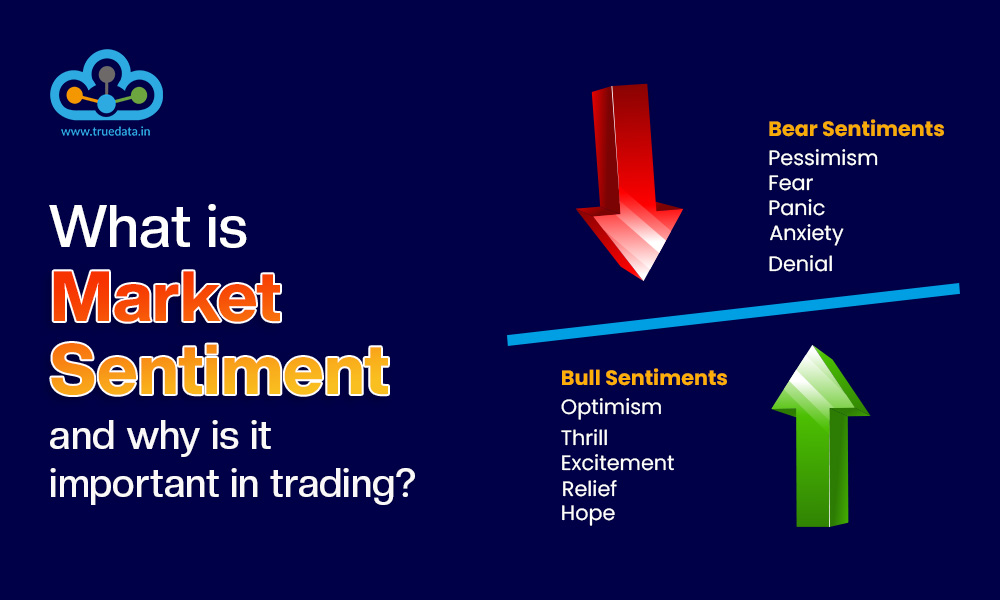
Market sentiment indicators measure the collective psychology of investors — the emotional backdrop that drives buying and selling decisions across financial markets. While fundamentals reveal what an asset should be worth and technical analysis shows how price is moving, sentiment reveals how market participants feel about those movements. This emotional dimension often creates extremes: periods of euphoria that push prices beyond rational valuations, or waves of panic that drive assets below intrinsic value.
Understanding current financial market sentiment indicators helps traders anticipate potential reversals, identify overbought or oversold conditions, and time entries or exits with greater accuracy.
What Is a Market Sentiment Indicator, and Why Does It Matter?
A market sentiment indicator is a tool that quantifies investor optimism or fear by analyzing survey responses, trading activity, volatility levels, or market breadth. These indicators translate emotional positioning into measurable data, helping traders gauge whether the crowd is leaning bullish, bearish, or neutral.
Investor sentiment matters because extremes often precede reversals. When optimism reaches unsustainable levels, markets become vulnerable to corrections as buyers exhaust themselves. Conversely, when fear dominates and pessimism peaks, selling pressure may be nearing exhaustion, creating opportunities for recovery. Recognizing these inflection points allows traders to position against the crowd at critical moments, improving risk-adjusted returns.
How To Identify Market Sentiment Using Key Indicators
Traders rely on several categories of sentiment indicators, each offering distinct perspectives on market psychology:
- Survey-Based Indicators: The AAII Sentiment Survey measures whether individual investors are bullish, bearish, or neutral. Bullish readings above 50% often coincide with market tops, while bearish readings exceeding 50% can signal bottoms. The Investors Intelligence Ratio tracks newsletter writer sentiment, with extreme consensus frequently appearing at turning points.
- Options-Based Indicators: The put/call ratio indicator compares put option volume to call option volume. Readings above 1.0 indicate heightened fear, while values below 0.7 suggest complacency. The COT Report discloses futures positioning, offering insight into institutional behavior.
- Volatility-Based Indicators: The VIX tracks expected volatility in the S&P 500. Values above 30 indicate elevated fear and potential bottoms, while readings below 15 signal calm conditions that may precede corrections. Additional volatility indicators help assess risk appetite across asset classes.
- Market Breadth Indicators: The Advance/Decline Line compares advancing to declining stocks. The High-Low Index tracks 52-week highs versus lows, while the Bullish Percent Index measures stocks on buy signals—readings above 70% indicate overbought conditions, below 30% suggests oversold markets.
- Composite and Modern Tools: The Fear and Greed Index combines seven metrics into a single score from 0 (extreme fear) to 100 (extreme greed). Social media sentiment analysis uses natural language processing to assess financial discussions, providing real-time insight into retail positioning.
What Is the Best Market Sentiment Indicator for Traders?
No single sentiment indicator serves all trading strategies or market conditions. The most effective approach depends on the assets traded, time horizon, and analytical framework.
The VIX works well for equity traders focused on volatility and risk management. Spikes above 30 historically align with panic selling and attractive entry points. The put/call ratio indicator suits options traders seeking extremes in derivatives positioning, particularly when combined with strike-level analysis.
Survey-based indicators like the AAII Sentiment Survey benefit swing traders and position traders on weekly or monthly timeframes, as retail sentiment shifts develop gradually. The Fear and Greed Index provides a comprehensive snapshot for traders preferring a single composite measure. Day traders often prioritize real-time social sentiment tools and intraday breadth metrics that capture rapid momentum shifts.
How Does Sentiment Affect Trading and Market Behavior?
Sentiment drives the supply and demand dynamics that create price movements. During euphoria, investors bid up prices across sectors, eventually exhausting buying power and leaving markets vulnerable to corrections. Conversely, fear-driven selling creates oversold conditions where assets trade below fundamental value, presenting opportunities for disciplined buyers.
Historical examples illustrate these patterns. During the March 2020 COVID-19 panic, the VIX surged above 80 as fear peaked, marking the bottom for equities before a 100%+ rally over 18 months. In early 2018, complacency drove the VIX below 10, preceding a sharp correction that erased months of gains within days.
Sentiment extremes matter most when they contradict technical structure or fundamental conditions. A market showing resilience during peak pessimism offers stronger buy signals than one exhibiting weakness during optimism. For broader context on identifying trends and analyzing trading markets, additional resources provide complementary perspectives.
How To Use Sentiment Analysis in Trading Strategies
Applying sentiment indicators requires integrating them with technical and fundamental analysis. Contrarian approaches work best at extremes. When the VIX spikes above 30 and the put/call ratio exceeds 1.2, identify oversold technical setups showing bullish divergence on RSI or MACD. When the Fear and Greed Index reaches 80+ and breadth deteriorates, reduce exposure or tighten stop-losses.
Sentiment also validates trend strength. A sustained uptrend with rising optimism suggests continued momentum. However, if prices rise while sentiment remains neutral or bearish, the move may have further room as skeptics capitulate. Pairing sentiment data with technical indicators for day trading sharpens timing.
Avoid chasing rallies during euphoric sentiment or panic selling during extreme fear if technical support holds and fundamentals remain intact. Sentiment works best as a confirmation tool, not a standalone signal.
Real-World Examples of Market Sentiment Shifts
Sentiment shifts often precede major market movements. In December 2018, the AAII Sentiment Survey showed bearish sentiment above 50% — a rare extreme. Investors who recognized this excessive pessimism and bought near support captured the 2019 rally, with the S&P 500 gaining over 28%.
During 2021, social sentiment indicators detected extreme retail optimism before meme stock market reversals. Parabolic moves with overwhelmingly bullish chatter often corrected sharply once momentum faded.
The 2022 bear market showed how persistent pessimism delays recoveries. Despite multiple oversold technical conditions, negative sentiment maintained pressure until late in the year. Traders who waited for both sentiment exhaustion and technical confirmation avoided premature entries.
These examples underscore that sentiment provides valuable signals when combined with price structure and volume analysis, but rarely works in isolation.
Refine Your Approach with Professional Sentiment Tools
Market sentiment indicators reveal the emotional forces shaping price action, helping you identify extremes that precede reversals and validate trend strength. By monitoring survey data, options activity, volatility levels, and breadth metrics, you can gauge whether optimism or fear has reached unsustainable levels.
If you’re ready to incorporate systematic sentiment analysis into a comprehensive trading framework, explore Above the Green Line’s membership options. Members gain access to proprietary indicators, sector rotation strategies, and actionable market insights designed to help you respond effectively to shifts in investor psychology across evolving market environments.

Related Articles

International Shipping Index: What It Reveals About Global Trade Trends

Understanding Market Microstructure for Better Trading Decisions
Understanding the Liquidity Trap and Its Impact on Investors

How Government Shutdowns Can Affect Stock Markets and Trading Strategies