Above the Green Line -01
  • Market Insights
        • Commentary
          • Daily
          • Weekly
        • BUY / SELL SIGNALS
          • Trade Posts
          • Recent Trade Alerts
          • Recent Day Trades
        • BLOGROLL
          • Dividend Growth Blog
          • ETF Sector Blog
          • Dow Dogs
          • TPOW Blog
  • Strategies
        • SWING TRADING
          • Current Positions
          • Watchlists
          • Closed Positions
          • Candidates - TOP 100
          • Specialty Stocks
        • WEEKLY STOCK PICK
          • TPOW Charts
          • TPOW Performance
          • TPOW Strategy Guide
          • TPOW Performance Dashboard
          • Why Weekly Trading Works
        • DAY TRADING
          • Watch List
        • ATGL DASHBOARD
        • ETF STRATEGIES
          • ETF Sector Rotation
          • ETF Sector Portfolio
        • DIVIDEND GROWTH
          • Dividend Growth Portfolio
          • Dividend Calendar
        • DOGS OF THE DOW
          • Dogs of the Dow Portfolio
          • DOW 5 Portfolio
  • Markets
        • US MARKET
          • Commodities
          • Energy
          • Precious Metals
          • Volatility
        • GLOBAL MARKETS
          • Market Indices
          • Economic Calendar
          • FOREX Heat Map
          • FOREX Cross Rates
          • Crypto Currency Market
  • Investing
    • Discord Community
    • Dashboard
  • Resources
        • INVESTING GUIDES
          • Dividend Growth Guide
          • Investment Strategy Framework
          • ETF Investing Handbook
          • Stock Trading Handbook
        • ARTICLES
          • Dividend Growth Model Articles
          • ETF Articles
          • Investment Strategies Articles
          • Market and Economic Insights
          • Stock Trade Articles
          • Stock Reviews
        • TOOLS
          • Stock Scanners
          • Charting Software
          • Brokerage Firms
          • Stocks We Review
        • STOCK CHARTS
          • Key Components
          • Reading Charts
          • Drawing Stock Charts
          • Identifying Trends
  • About
    • Contact Us
    • How to Win
    • #1 At Stockcharts
    • Disclaimer
    • FAQ
  • Log In
  • Subscribe

June 27, 2017

Money Wave Alert! Jun 27, 2017

SPX Chart

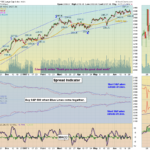
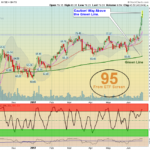
S&P 500 Hourly Chart   Markets are down today, as the S&P 500 fell below the Pink Line (10-day avg) to create selling.  The target now is the Red Line (50-day avg.)  around 2408, where Buyers should come back in.   The Techs … [Read more...]

June 26, 2017

Money Wave Alert! Jun 26, 2017

QQQ Chart

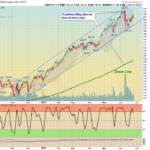
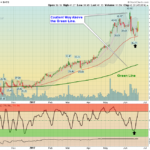
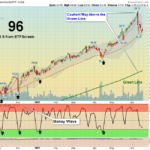
  Markets "Gapped Up" on the opening, and then went negative for a while today. The Techs were up, buy many have Reversed down today. The NASDAQ 100 Index is going back up to re-test the mid June Highs, but it is already in the Red … [Read more...]

June 25, 2017

Weekly Commentary Jun 25, 2017

XLK Chart

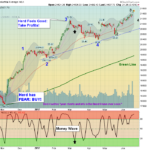
  06/25/2017:  Markets were up slightly for the week, but the TECH Stocks bounced at the Support of the Red Lines (50-day avgs) and were up 2%. Many Investments are already back up in the Red Zones (probably too late to Buy for the Short … [Read more...]

June 23, 2017

Money Wave Alert! Jun 23, 2017

QQQ Chart

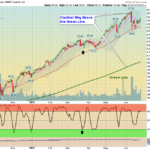
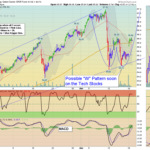
  Markets are mixed again, but many  Techs are up today. The NASDAQ 100 Index is going back up to re-test the mid June Highs, but it is already in the Red Zone. The S&P 500 is still trying to hold at the Pink Line (10-day avg). Bonds … [Read more...]

June 22, 2017

Money Wave Alert! Jun 22, 2017

XBI Chart

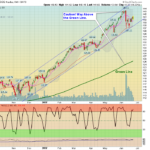
Markets are up slightly, as the  Techs and Oil are both higher. The S&P 500 is still trying to hold at the Pink Line (10-day avg). Bonds are seeing weakness...    Money Wave Buys soon!   The Following Investments will probably have … [Read more...]

June 21, 2017

Money Wave Alert! Jun 21, 2017

JD Chart

  Markets are mixed today, as the  Techs are up and Oil is lower. The DOW Index is currently holding up the best.  Bonds are seeing weakness... Somebody is wrong! The BioTechs have broken out this week.   Money Wave Buys … [Read more...]

June 20, 2017

Money Wave Alert! Jun 20, 2017

INDU Chart

  Markets are down slightly today, as the  Techs, Financials and Oil are weak. The Markets are filling some of the GAPS left from Monday's pop..   Money Wave Buys soon!   The Following Investments will probably have a Money … [Read more...]

June 19, 2017

Money Wave Alert! Jun 19, 2017

XLK Chart

  Markets "Gapped Up" today as the Leading Techs and Semiconductors  bounced from being Over-Sold. The S&P 500  was also able to hold Above the Pink Line (10-day avg.) around 2435, to avoid a Short Term Sell Signal.  The Leading Techs … [Read more...]

June 18, 2017

Weekly Commentary Jun 18, 2017

SMH Chart

    Happy Father's Day! 06/18/2017:  Markets were mostly mixed for the week, and the TECH Stocks are still battling it out at the Support of the Red Lines (50-day avgs). Money that has left the NASDAQ 100 and the Fab Five FAANG … [Read more...]

June 16, 2017

Money Wave Alert! Jun 16, 2017

WFM Chart

  Looks like AMAZON saw that WHOLE FOODS was coming out of a Bear Market, also. Too bad the Relative Strength dropped so low (below 50) yesterday, as we were waiting to Buy WFM for a Long Term Hold.  Markets are down slightly today, but … [Read more...]

  • « Previous Page
  • 1
  • …
  • 522
  • 523
  • 524
  • 525
  • 526
  • …
  • 559
  • Next Page »

Subscribe to Our Newsletter

AGL Logo

Get our eBook Now!

Candlestick - A Swing Traders Friend

We don’t spam! Read our privacy policy for more info.

You’ve been successfully subscribed to our newsletter!

Voted #1 at Stock Charts

SH Chart
Inverse S&P 500 Fund (SH) will have a Money Wave Buy today.

Help Us Help Animals

Help Us Help Animals

Recent Comments

  • ATGL Weekly Money Flow - 2026-02-08 on ATGL Top Pick of the Week! Jan 25, 2026
  • ATGL Weekly Money Flow - 2026-01-25 on ATGL Top Pick of the Week! Jan 11, 2026
  • ATGL Weekly Money Flow - 2025-12-28 on ATGL Top Pick of the Week Dec 21, 2025
  • Inside Bar Trading Strategy: Improve Timing and Wins on Price Action Trading: Mastering the Art of Reading the Market Without Indicators
  • Breakaway Gap Explained: Identify High-Probability Setups on Identifying Market Exhaustion Signals for Smarter Trading Decisions

Become a Green Liner!

Help me make more Money in the Stock Market.

ON ATGL

  • DashBoard
  • Weekly Commentary
  • Daily Buy / Sell Signals
  • Day Trade Setup
  • Trading Rooms

Design & Develop By Pixelvect

STRATEGIES

  • Swing Trading
  • ATGL Pick of the Week
  • Dividend Growth
  • ETF Sector Rotation
  • Dogs of the Dow

HELP

  • ATGL Trading Rules
  • FAQ
  • Account Maintenance
  • Contact US
  • Join

FOLLOW US

Instagram Linkedin Twitter Facebook

© COPYRIGHT 2024 · ABOVETHEGREENLINE.COM · ALL RIGHTS RESERVED · PRIVACY · TERMS · CONTACT · WATCHLIST · CURRENT