Above the Green Line -01
  • Market Insights
        • Commentary
          • Daily
          • Weekly
        • BUY / SELL SIGNALS
          • Trade Posts
          • Recent Trade Alerts
          • Recent Day Trades
        • BLOGROLL
          • Dividend Growth Blog
          • ETF Sector Blog
          • Dow Dogs
          • TPOW Blog
  • Strategies
        • SWING TRADING
          • Current Positions
          • Watchlists
          • Closed Positions
          • Candidates - TOP 100
          • Specialty Stocks
        • WEEKLY STOCK PICK
          • TPOW Charts
          • TPOW Performance
          • TPOW Strategy Guide
          • TPOW Performance Dashboard
          • Why Weekly Trading Works
        • DAY TRADING
          • Watch List
        • ATGL DASHBOARD
        • ETF STRATEGIES
          • ETF Sector Rotation
          • ETF Sector Portfolio
        • DIVIDEND GROWTH
          • Dividend Growth Portfolio
          • Dividend Calendar
        • DOGS OF THE DOW
          • Dogs of the Dow Portfolio
          • DOW 5 Portfolio
  • Markets
        • US MARKET
          • Commodities
          • Energy
          • Precious Metals
          • Volatility
        • GLOBAL MARKETS
          • Market Indices
          • Economic Calendar
          • FOREX Heat Map
          • FOREX Cross Rates
          • Crypto Currency Market
  • Investing
    • Discord Community
    • Dashboard
  • Resources
        • INVESTING GUIDES
          • Dividend Growth Guide
          • Investment Strategy Framework
          • ETF Investing Handbook
          • Stock Trading Handbook
        • ARTICLES
          • Dividend Growth Model Articles
          • ETF Articles
          • Investment Strategies Articles
          • Market and Economic Insights
          • Stock Trade Articles
          • Stock Reviews
        • TOOLS
          • Stock Scanners
          • Charting Software
          • Brokerage Firms
          • Stocks We Review
        • STOCK CHARTS
          • Key Components
          • Reading Charts
          • Drawing Stock Charts
          • Identifying Trends
  • About
    • Contact Us
    • How to Win
    • #1 At Stockcharts
    • Disclaimer
    • FAQ
  • Log In
  • Subscribe

July 21, 2017

Money Wave Alert! Jul 21, 2017

DIA Chart

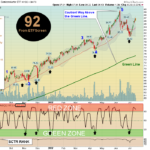
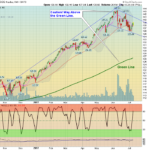
  Markets are down slightly today, as Buyers are hesitant to Buy on the Highs and most Leaders are in the Red Zones (probably too late to Buy for the Short Term). Short Term Traders should raise CASH, or have tight Sell Stops in. Please be … [Read more...]

July 20, 2017

Money Wave Alert! Jul 20, 2017

QQQ Chart

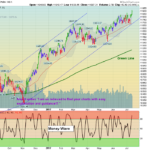
  Markets are up slightly today, but Buyers are hesitant to Buy on the Highs and in the Red Zones (probably too late to Buy for the Short Term). Short Term Traders should raise CASH, or have tight Sell Stops in. Please be patient and WAIT … [Read more...]

July 19, 2017

Money Wave Alert! Jul 19, 2017

Portfolio Chart

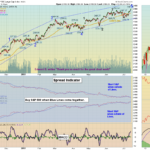
  Markets are up more today, as Mutual Funds insist on Buying on the Highs. Most of the Leaders are in the Red Zones (probably too late to Buy for the Short Term) so Short Term Traders should raise CASH, or have tight Sell Stops in. Please … [Read more...]

July 18, 2017

Money Wave Alert! Jul 18, 2017

NFLX Chart

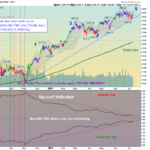
  Markets are mixed again today, as the DOW is down, but the NASDAQ 100 is up with NFLX Earnings. NFLX is up 14% today with a 200+ P/E Ratio, as the Mutual Funds pile in, and the Shorts get Blown Out. There is little follow thru of  buying … [Read more...]

July 17, 2017

Money Wave Alert! Jul 17, 2017

SMH Chart

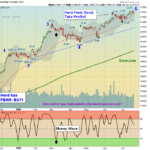
  Markets are mixed today, as there is little follow thru of  buying after the  S&P 500  was able to make New Highs today on Friday.  The June High of 2453 was exceeded by about 10 points. The Tech Stocks are mostly in the Red Zones … [Read more...]

July 16, 2017

Weekly Commentary Jul 16, 2017

NYSE Chart

  07/16/2017:  Markets finally bounced off the Red Lines (50-day avg.) and are back up to the Highs. We will see if the S&P 500 can push higher this week. Most Funds are in the Red Zones, so Short Term Traders should be raising … [Read more...]

July 14, 2017

Money Wave Alert! Jul 14, 2017

SPX Chart

  Markets are up again today, as the S&P 500 has been able to make New Highs today on lower Volume.  The June High of 2453 was exceeded by about 7 points today. The Tech Stocks are mostly in the Red Zones (probably too late to Buy for … [Read more...]

July 13, 2017

Money Wave Alert! Jul 13, 2017

NYSE Chart

  Markets are up slightly today, as the S&P 500 tries to make New Highs soon so the rally can continue.  The June High was 2453, about 4 points higher than today. The Tech Stocks are mostly in the Red Zones, and are struggling today … [Read more...]

July 12, 2017

Money Wave Alert! Jul 12, 2017

SPX Chart

  Markets "Gapped Up" today, as the S&P 500 tries to make New Highs soon so the rally can continue.  The June High was 2453, about 8 points higher than today. The Tech Stocks are mostly in the Red Zones (probably too late to Buy for … [Read more...]

July 11, 2017

Money Wave Alert! Jul 11, 2017

QQQ Chart

  Markets are up slightly again today, as the S&P 500 tries to make New Highs soon so the rally can continue.   The Tech Stocks are quickly getting back up into the Red Zones (probably too late to Buy for the Short Term). Bonds have … [Read more...]

  • « Previous Page
  • 1
  • …
  • 520
  • 521
  • 522
  • 523
  • 524
  • …
  • 559
  • Next Page »

Subscribe to Our Newsletter

AGL Logo

Get our eBook Now!

Candlestick - A Swing Traders Friend

We don’t spam! Read our privacy policy for more info.

You’ve been successfully subscribed to our newsletter!

Voted #1 at Stock Charts

SH Chart
Inverse S&P 500 Fund (SH) will have a Money Wave Buy today.

Help Us Help Animals

Help Us Help Animals

Recent Comments

  • ATGL Weekly Money Flow - 2026-02-08 on ATGL Top Pick of the Week! Jan 25, 2026
  • ATGL Weekly Money Flow - 2026-01-25 on ATGL Top Pick of the Week! Jan 11, 2026
  • ATGL Weekly Money Flow - 2025-12-28 on ATGL Top Pick of the Week Dec 21, 2025
  • Inside Bar Trading Strategy: Improve Timing and Wins on Price Action Trading: Mastering the Art of Reading the Market Without Indicators
  • Breakaway Gap Explained: Identify High-Probability Setups on Identifying Market Exhaustion Signals for Smarter Trading Decisions

Become a Green Liner!

Help me make more Money in the Stock Market.

ON ATGL

  • DashBoard
  • Weekly Commentary
  • Daily Buy / Sell Signals
  • Day Trade Setup
  • Trading Rooms

Design & Develop By Pixelvect

STRATEGIES

  • Swing Trading
  • ATGL Pick of the Week
  • Dividend Growth
  • ETF Sector Rotation
  • Dogs of the Dow

HELP

  • ATGL Trading Rules
  • FAQ
  • Account Maintenance
  • Contact US
  • Join

FOLLOW US

Instagram Linkedin Twitter Facebook

© COPYRIGHT 2024 · ABOVETHEGREENLINE.COM · ALL RIGHTS RESERVED · PRIVACY · TERMS · CONTACT · WATCHLIST · CURRENT