Above the Green Line -01
  • Market Insights
        • Commentary
          • Daily
          • Weekly
        • BUY / SELL SIGNALS
          • Trade Posts
          • Recent Trade Alerts
          • Recent Day Trades
        • BLOGROLL
          • Dividend Growth Blog
          • ETF Sector Blog
          • Dow Dogs
          • TPOW Blog
  • Strategies
        • SWING TRADING
          • Current Positions
          • Watchlists
          • Closed Positions
          • Candidates - TOP 100
          • Specialty Stocks
        • WEEKLY STOCK PICK
          • TPOW Charts
          • TPOW Performance
          • TPOW Strategy Guide
          • TPOW Performance Dashboard
          • Why Weekly Trading Works
        • DAY TRADING
          • Watch List
        • ATGL DASHBOARD
        • ETF STRATEGIES
          • ETF Sector Rotation
          • ETF Sector Portfolio
        • DIVIDEND GROWTH
          • Dividend Growth Portfolio
          • Dividend Calendar
        • DOGS OF THE DOW
          • Dogs of the Dow Portfolio
          • DOW 5 Portfolio
  • Markets
        • US MARKET
          • Commodities
          • Energy
          • Precious Metals
          • Volatility
        • GLOBAL MARKETS
          • Market Indices
          • Economic Calendar
          • FOREX Heat Map
          • FOREX Cross Rates
          • Crypto Currency Market
  • Investing
    • Discord Community
    • Dashboard
  • Resources
        • INVESTING GUIDES
          • Dividend Growth Guide
          • Investment Strategy Framework
          • ETF Investing Handbook
          • Stock Trading Handbook
        • ARTICLES
          • Dividend Growth Model Articles
          • ETF Articles
          • Investment Strategies Articles
          • Market and Economic Insights
          • Stock Trade Articles
          • Stock Reviews
        • TOOLS
          • Stock Scanners
          • Charting Software
          • Brokerage Firms
          • Stocks We Review
        • STOCK CHARTS
          • Key Components
          • Reading Charts
          • Drawing Stock Charts
          • Identifying Trends
  • About
    • Contact Us
    • How to Win
    • #1 At Stockcharts
    • Disclaimer
    • FAQ
  • Log In
  • Subscribe

October 1, 2017

Green Line Weekly Oct 1, 2017

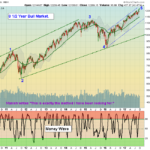
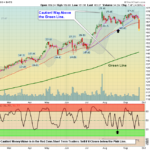
  10/01/2017:  Markets were back up to the Highs for the week, as the Small Caps and S&P 500 made Higher Highs. The DOW Index and NASDAQ 100 did not make Highs, as money has been rotating out of the over-bought sectors and into the weaker … [Read more...]

September 29, 2017

Money Wave Alert! Sep 29, 2017

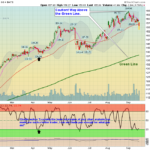
  Markets are up slightly today, as the Mutual Funds are doing some End of Quarter Buying. October is coming. Be patient and  WAIT for some negative news to return the Leaders back down to their Green Zone for Money Wave Buys..  The … [Read more...]

September 28, 2017

Money Wave Alert! Sep 28, 2017

SMH Chart

  Markets are mixed today, as the Strongest Indices are back up near the Highs. Many  Watch List Money Wave Buy today, but the Volume is weak on all of them. We would prefer that all the Indices also correct down some. Be patient and … [Read more...]

September 27, 2017

Money Wave Alert! Sep 27, 2017

DIA 60 Chart

  Markets are up today, as the Techs are bouncing from Over-Sold conditions. The DOW Index could be going up on Wave 5 since it bounced off the Red Line (50-day avg.) in late August. The Watch List is growing, as some Leaders are back … [Read more...]

September 26, 2017

Money Wave Alert! Sep 26, 2017

QQQ Chart

  A very slow day today, as the Markets are up slightly. Some of the Strong Investments are becoming Over-Sold, and in the Green Zones. The Watch List is growing, as some Leaders are back down near their Red Lines (50-day avgs.) for possible … [Read more...]

September 25, 2017

Money Wave Alert! Sep 25, 2017

FB Chart

  Markets are down today  as the S&P 500 slipped below the Pink Line (10-day avg.) to create a Short Term Sell Signal. Most of the Indices were back up in the Red Zones (probably too late to Buy for the Short Term). WAIT for some … [Read more...]

September 24, 2017

Green Line Weekly Sep 24, 2017

AAPL Chart

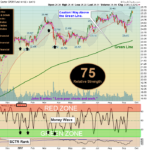
  09/24/2017:  Markets were up slightly for the week, but most Funds are back up in the Red Zones, so Nimble traders should be raising Cash.  Most of the News has been GOOD, and Investors feel very confident. This is historically a "profit … [Read more...]

September 22, 2017

Money Wave Alert! Sep 22, 2017

XLF Chart

  Markets are mixed today on a small range day, as the S&P 500 tries to hold above the Pink Line (10-day avg.) to Avoid a Short Term Sell Signal. Most of the Indices are back up in the Red Zones (probably too late to Buy for the Short … [Read more...]

September 21, 2017

Money Wave Alert! Sep 21, 2017

SPX Chart

  Markets are down slightly today on mild selling, as the S&P 500 tries to hold above the Pink Line (10-day avg.) to Avoid a Short Term Sell Signal. Most of the Indices are back up in the Red Zones (probably too late to Buy for the … [Read more...]

September 20, 2017

Money Wave Alert! Sep 20, 2017

AAPL Chart

  Markets are mixed today, after dropping briefly after the FED talk at 1:00pm EDT. The FED threw out a "Trial Balloon" that they will soon begin selling the $4 Trillion of Debt they bought to prop up the Markets after the 2008 Dump. The … [Read more...]

  • « Previous Page
  • 1
  • …
  • 514
  • 515
  • 516
  • 517
  • 518
  • …
  • 559
  • Next Page »

Subscribe to Our Newsletter

AGL Logo

Get our eBook Now!

Candlestick - A Swing Traders Friend

We don’t spam! Read our privacy policy for more info.

You’ve been successfully subscribed to our newsletter!

Voted #1 at Stock Charts

SH Chart
Inverse S&P 500 Fund (SH) will have a Money Wave Buy today.

Help Us Help Animals

Help Us Help Animals

Recent Comments

  • ATGL Weekly Money Flow - 2026-02-08 on ATGL Top Pick of the Week! Jan 25, 2026
  • ATGL Weekly Money Flow - 2026-01-25 on ATGL Top Pick of the Week! Jan 11, 2026
  • ATGL Weekly Money Flow - 2025-12-28 on ATGL Top Pick of the Week Dec 21, 2025
  • Inside Bar Trading Strategy: Improve Timing and Wins on Price Action Trading: Mastering the Art of Reading the Market Without Indicators
  • Breakaway Gap Explained: Identify High-Probability Setups on Identifying Market Exhaustion Signals for Smarter Trading Decisions

Become a Green Liner!

Help me make more Money in the Stock Market.

ON ATGL

  • DashBoard
  • Weekly Commentary
  • Daily Buy / Sell Signals
  • Day Trade Setup
  • Trading Rooms

Design & Develop By Pixelvect

STRATEGIES

  • Swing Trading
  • ATGL Pick of the Week
  • Dividend Growth
  • ETF Sector Rotation
  • Dogs of the Dow

HELP

  • ATGL Trading Rules
  • FAQ
  • Account Maintenance
  • Contact US
  • Join

FOLLOW US

Instagram Linkedin Twitter Facebook

© COPYRIGHT 2024 · ABOVETHEGREENLINE.COM · ALL RIGHTS RESERVED · PRIVACY · TERMS · CONTACT · WATCHLIST · CURRENT