Above the Green Line -01
  • Market Insights
        • Commentary
          • Daily
          • Weekly
        • BUY / SELL SIGNALS
          • Trade Posts
          • Recent Trade Alerts
          • Recent Day Trades
        • BLOGROLL
          • Dividend Growth Blog
          • ETF Sector Blog
          • Dow Dogs
          • TPOW Blog
  • Strategies
        • SWING TRADING
          • Current Positions
          • Watchlists
          • Closed Positions
          • Candidates - TOP 100
          • Specialty Stocks
        • WEEKLY STOCK PICK
          • TPOW Charts
          • TPOW Performance
          • TPOW Strategy Guide
          • TPOW Performance Dashboard
          • Why Weekly Trading Works
        • DAY TRADING
          • Watch List
        • ATGL DASHBOARD
        • ETF STRATEGIES
          • ETF Sector Rotation
          • ETF Sector Portfolio
        • DIVIDEND GROWTH
          • Dividend Growth Portfolio
          • Dividend Calendar
        • DOGS OF THE DOW
          • Dogs of the Dow Portfolio
          • DOW 5 Portfolio
  • Markets
        • US MARKET
          • Commodities
          • Energy
          • Precious Metals
          • Volatility
        • GLOBAL MARKETS
          • Market Indices
          • Economic Calendar
          • FOREX Heat Map
          • FOREX Cross Rates
          • Crypto Currency Market
  • Investing
    • Discord Community
    • Dashboard
  • Resources
        • INVESTING GUIDES
          • Dividend Growth Guide
          • Investment Strategy Framework
          • ETF Investing Handbook
          • Stock Trading Handbook
        • ARTICLES
          • Dividend Growth Model Articles
          • ETF Articles
          • Investment Strategies Articles
          • Market and Economic Insights
          • Stock Trade Articles
          • Stock Reviews
        • TOOLS
          • Stock Scanners
          • Charting Software
          • Brokerage Firms
          • Stocks We Review
        • STOCK CHARTS
          • Key Components
          • Reading Charts
          • Drawing Stock Charts
          • Identifying Trends
  • About
    • Contact Us
    • How to Win
    • #1 At Stockcharts
    • Disclaimer
    • FAQ
  • Log In
  • Subscribe

October 13, 2017

Money Wave Alert! Oct 13, 2017

BABA Chart

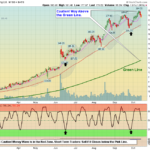
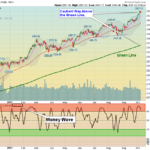
  Markets are up slightly today, and are holding above the Pink Lines (10-day avgs.) to avoid Short Term Sell Signals. The BioTech Fund is quickly back down in the Green Zone. Most of the Leaders are in the Red Zones (probably too late to … [Read more...]

October 12, 2017

Money Wave Alert! Oct 12, 2017

SPX Chart

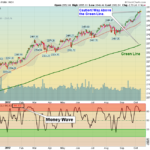
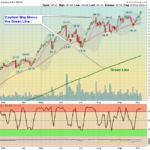
  Markets are down slightly again today, but are still holding above the Pink Lines (10-day avgs.), to avoid Short Term Sell Signals. Financials & BioTechs might close Below the Pink Lines today. Most of the Leaders are in the Red … [Read more...]

October 11, 2017

Money Wave Alert! Oct 11, 2017

XLF Chart

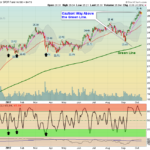
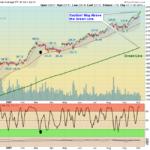
  Markets are up slightly again today, as there are currently very few Sellers.  When the Markets close below the Pink Lines (10-day avgs.), that should create a Short Term Sell Signal. Most of the Leaders are in the Red Zones (probably … [Read more...]

October 10, 2017

Money Wave Alert! Oct 10, 2017

SMH Chart

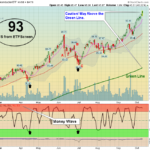
  Markets are up slightly today, as undisciplined Investors don't have the patience to wait for a pull-back.  When the Markets close below the Pink Lines (10-day avgs.), that should create a Short Term Sell Signal. Most of the Leaders are … [Read more...]

October 9, 2017

Money Wave Alert! Oct 9, 2017

SPX Chart

  Markets are down slightly today, after last week's rally.  Should be small bounces off the Pink Lines soon (10-day avgs.) Most of the Leaders are in the Red Zones (probably too late to Buy for the Short Term), so Short Term Traders … [Read more...]

October 6, 2017

Money Wave Alert! Oct 6, 2017

QQQ Chart

  Markets are mixed today, after yesterday's rally.  Investors must be betting on a new Tax Plan soon. Most of the Leaders are in the Red Zones (probably too late to Buy for the Short Term), so Short Term Traders should be raising Cash. … [Read more...]

October 5, 2017

Money Wave Alert! Oct 5, 2017

DIA Chart

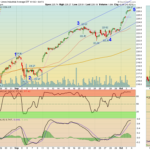
  Markets are higher again today, and now it is looking like a "Melt Up" is forming. This could be HISTORIC, as Investors Panic Buy after 8 1/2 year tired Bull (Dow is 2200 points Above the Green Line).  Must be betting on a new Tax Plan. … [Read more...]

October 4, 2017

Money Wave Alert! Oct 4, 2017

    More of the same... Markets are up slightly again today, as there are few Sellers. Most of the Leaders are in the Red Zones (probably too late to Buy for the Short Term), so Short Term Traders should be raising Cash. The … [Read more...]

October 3, 2017

Money Wave Alert! Oct 3, 2017

DIA Chart

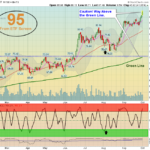
    Markets are up again today, as there are few Sellers. Notice how none of the 9 recent Money Wave Buy Leaders have made New Highs this time up! The Markets seem to be running on upward momentum.  The Semiconductors and … [Read more...]

October 2, 2017

Money Wave Alert! Oct 2, 2017

XBI Chart

  Markets are up again today, on a Buying stampede. The Markets seem to be running on upward momentum. The DOW Index is catching up, and made New Highs also. The Semiconductors and BioTechs are  the Strongest Sectors to buy, but they are … [Read more...]

  • « Previous Page
  • 1
  • …
  • 513
  • 514
  • 515
  • 516
  • 517
  • …
  • 559
  • Next Page »

Subscribe to Our Newsletter

AGL Logo

Get our eBook Now!

Candlestick - A Swing Traders Friend

We don’t spam! Read our privacy policy for more info.

You’ve been successfully subscribed to our newsletter!

Voted #1 at Stock Charts

SH Chart
Inverse S&P 500 Fund (SH) will have a Money Wave Buy today.

Help Us Help Animals

Help Us Help Animals

Recent Comments

  • ATGL Weekly Money Flow - 2026-02-08 on ATGL Top Pick of the Week! Jan 25, 2026
  • ATGL Weekly Money Flow - 2026-01-25 on ATGL Top Pick of the Week! Jan 11, 2026
  • ATGL Weekly Money Flow - 2025-12-28 on ATGL Top Pick of the Week Dec 21, 2025
  • Inside Bar Trading Strategy: Improve Timing and Wins on Price Action Trading: Mastering the Art of Reading the Market Without Indicators
  • Breakaway Gap Explained: Identify High-Probability Setups on Identifying Market Exhaustion Signals for Smarter Trading Decisions

Become a Green Liner!

Help me make more Money in the Stock Market.

ON ATGL

  • DashBoard
  • Weekly Commentary
  • Daily Buy / Sell Signals
  • Day Trade Setup
  • Trading Rooms

Design & Develop By Pixelvect

STRATEGIES

  • Swing Trading
  • ATGL Pick of the Week
  • Dividend Growth
  • ETF Sector Rotation
  • Dogs of the Dow

HELP

  • ATGL Trading Rules
  • FAQ
  • Account Maintenance
  • Contact US
  • Join

FOLLOW US

Instagram Linkedin Twitter Facebook

© COPYRIGHT 2024 · ABOVETHEGREENLINE.COM · ALL RIGHTS RESERVED · PRIVACY · TERMS · CONTACT · WATCHLIST · CURRENT