Above the Green Line -01
  • Market Insights
        • Commentary
          • Daily
          • Weekly
        • BUY / SELL SIGNALS
          • Trade Posts
          • Recent Trade Alerts
          • Recent Day Trades
        • BLOGROLL
          • Dividend Growth Blog
          • ETF Sector Blog
          • Dow Dogs
          • TPOW Blog
  • Strategies
        • SWING TRADING
          • Current Positions
          • Watchlists
          • Closed Positions
          • Candidates - TOP 100
          • Specialty Stocks
        • WEEKLY STOCK PICK
          • TPOW Charts
          • TPOW Performance
          • TPOW Strategy Guide
          • TPOW Performance Dashboard
          • Why Weekly Trading Works
        • DAY TRADING
          • Watch List
        • ATGL DASHBOARD
        • ETF STRATEGIES
          • ETF Sector Rotation
          • ETF Sector Portfolio
        • DIVIDEND GROWTH
          • Dividend Growth Portfolio
          • Dividend Calendar
        • DOGS OF THE DOW
          • Dogs of the Dow Portfolio
          • DOW 5 Portfolio
  • Markets
        • US MARKET
          • Commodities
          • Energy
          • Precious Metals
          • Volatility
        • GLOBAL MARKETS
          • Market Indices
          • Economic Calendar
          • FOREX Heat Map
          • FOREX Cross Rates
          • Crypto Currency Market
  • Investing
    • Discord Community
    • Dashboard
  • Resources
        • INVESTING GUIDES
          • Dividend Growth Guide
          • Investment Strategy Framework
          • ETF Investing Handbook
          • Stock Trading Handbook
        • ARTICLES
          • Dividend Growth Model Articles
          • ETF Articles
          • Investment Strategies Articles
          • Market and Economic Insights
          • Stock Trade Articles
          • Stock Reviews
        • TOOLS
          • Stock Scanners
          • Charting Software
          • Brokerage Firms
          • Stocks We Review
        • STOCK CHARTS
          • Key Components
          • Reading Charts
          • Drawing Stock Charts
          • Identifying Trends
  • About
    • Contact Us
    • How to Win
    • #1 At Stockcharts
    • Disclaimer
    • FAQ
  • Log In
  • Subscribe

November 21, 2017

Money Wave Alert! Nov 21, 2017

XLF Chart

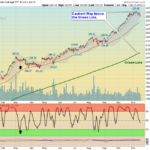
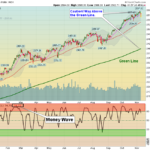
  Markets "Gapped Up" today on more Good News,  with light Holiday Buying, Most Indices made Higher Highs today.  The Financials and BioTechs are weaker, and are not making new Highs. Markets are generally up on Holiday weeks, as the … [Read more...]

November 20, 2017

Money Wave Alert! Nov 20, 2017

SMH Chart

  Markets were up slightly today on light Holiday Buying, and another try at the Highs.  We will find out soon if the Markets fail up here, or push Higher.  The  Tech Stocks and the DOW are currently the Strongest Indices to Buy on … [Read more...]

November 17, 2017

Money Wave Alert! Nov 17, 2017

SPX Chart

  Markets were down slightly today on weak Selling. The Leaders are back up near last week's Highs. We will find out soon if the Markets fail up here, or push Higher.  The  Tech Stocks and the DOW are currently the Strongest Indices. Be … [Read more...]

November 16, 2017

Money Wave Alert! Nov 16, 2017

QQQ Chart

  Markets "Gapped Up" today on more Good News Buying. The Leaders are back up near last week's Highs, to Fail, or push Higher.  The  Tech Stocks and the DOW are currently the Strongest Indices. Be patient and  WAIT for the Leaders to … [Read more...]

November 15, 2017

Money Wave Alert! Nov 15, 2017

DIA Chart

  Markets are down again, as the Leaders are slowly returning to their Green Zones for Buy Signals soon. The  Tech Stocks and the DOW are currently the Strongest Indices to Buy soon. Be patient and  WAIT for the Leaders to return to their … [Read more...]

November 14, 2017

Money Wave Alert! Nov 14, 2017

XBI Chart

  Markets are down today, but have recovered well off the morning lows. The Leading  Tech Stocks and the DOW are holding up the Markets, and should re-test last week's Highs. Be patient and  WAIT for the Leaders to return back down to … [Read more...]

November 13, 2017

Money Wave Alert! Nov 13, 2017

BOTZ Chart

  Markets are up slightly today, as the Leading  Tech Stocks are going up to re-test last week's Highs. The S&P 500 is struggling at the Pink Line (10-day avg.) of  2586.   Be patient and  WAIT for the Leaders to return back down to … [Read more...]

November 10, 2017

Money Wave Alert! Nov 10, 2017

GE Chart

  Markets are mixed today, and the S&P 500 was able to rally last night to stay above the Pink Line (10-day avg.) of  2584.  The Leading  Tech Stocks were able to bounce off the Pink Line, and should re-test the Highs soon. Be patient … [Read more...]

November 9, 2017

Money Wave Alert! Nov 9, 2017

SPX Chart

  Markets are down today, as the S&P 500 broke below the Pink Line (10-day avg.) of  2583 to create a Short Term Sell Signal.  The Leading  Tech Stocks were able to bounce off the Pink Line today, and should re-test the Highs soon. Be … [Read more...]

November 8, 2017

Money Wave Alert! Nov 8, 2017

CROX Chart

  Markets are mixed again today, but the Tech Stocks are higher and still holding the Markets up. Volume is Lower. The S&P 500 is still  holding Above the Pink Line (10-day avg.) of  2581 to avoid a Short Term Sell Signal.  Be … [Read more...]

  • « Previous Page
  • 1
  • …
  • 510
  • 511
  • 512
  • 513
  • 514
  • …
  • 559
  • Next Page »

Subscribe to Our Newsletter

AGL Logo

Get our eBook Now!

Candlestick - A Swing Traders Friend

We don’t spam! Read our privacy policy for more info.

You’ve been successfully subscribed to our newsletter!

Voted #1 at Stock Charts

SH Chart
Inverse S&P 500 Fund (SH) will have a Money Wave Buy today.

Help Us Help Animals

Help Us Help Animals

Recent Comments

  • ATGL Weekly Money Flow - 2026-02-08 on ATGL Top Pick of the Week! Jan 25, 2026
  • ATGL Weekly Money Flow - 2026-01-25 on ATGL Top Pick of the Week! Jan 11, 2026
  • ATGL Weekly Money Flow - 2025-12-28 on ATGL Top Pick of the Week Dec 21, 2025
  • Inside Bar Trading Strategy: Improve Timing and Wins on Price Action Trading: Mastering the Art of Reading the Market Without Indicators
  • Breakaway Gap Explained: Identify High-Probability Setups on Identifying Market Exhaustion Signals for Smarter Trading Decisions

Become a Green Liner!

Help me make more Money in the Stock Market.

ON ATGL

  • DashBoard
  • Weekly Commentary
  • Daily Buy / Sell Signals
  • Day Trade Setup
  • Trading Rooms

Design & Develop By Pixelvect

STRATEGIES

  • Swing Trading
  • ATGL Pick of the Week
  • Dividend Growth
  • ETF Sector Rotation
  • Dogs of the Dow

HELP

  • ATGL Trading Rules
  • FAQ
  • Account Maintenance
  • Contact US
  • Join

FOLLOW US

Instagram Linkedin Twitter Facebook

© COPYRIGHT 2024 · ABOVETHEGREENLINE.COM · ALL RIGHTS RESERVED · PRIVACY · TERMS · CONTACT · WATCHLIST · CURRENT