Above the Green Line -01
  • Market Insights
        • Commentary
          • Daily
          • Weekly
        • BUY / SELL SIGNALS
          • Trade Posts
          • Recent Trade Alerts
          • Recent Day Trades
        • BLOGROLL
          • Dividend Growth Blog
          • ETF Sector Blog
          • Dow Dogs
          • TPOW Blog
  • Strategies
        • SWING TRADING
          • Current Positions
          • Watchlists
          • Closed Positions
          • Candidates - TOP 100
          • Specialty Stocks
        • WEEKLY STOCK PICK
          • TPOW Charts
          • TPOW Performance
          • TPOW Strategy Guide
          • TPOW Performance Dashboard
          • Why Weekly Trading Works
        • DAY TRADING
          • Watch List
        • ATGL DASHBOARD
        • ETF STRATEGIES
          • ETF Sector Rotation
          • ETF Sector Portfolio
        • DIVIDEND GROWTH
          • Dividend Growth Portfolio
          • Dividend Calendar
        • DOGS OF THE DOW
          • Dogs of the Dow Portfolio
          • DOW 5 Portfolio
  • Markets
        • US MARKET
          • Commodities
          • Energy
          • Precious Metals
          • Volatility
        • GLOBAL MARKETS
          • Market Indices
          • Economic Calendar
          • FOREX Heat Map
          • FOREX Cross Rates
          • Crypto Currency Market
  • Investing
    • Discord Community
    • Dashboard
  • Resources
        • INVESTING GUIDES
          • Dividend Growth Guide
          • Investment Strategy Framework
          • ETF Investing Handbook
          • Stock Trading Handbook
        • ARTICLES
          • Dividend Growth Model Articles
          • ETF Articles
          • Investment Strategies Articles
          • Market and Economic Insights
          • Stock Trade Articles
          • Stock Reviews
        • TOOLS
          • Stock Scanners
          • Charting Software
          • Brokerage Firms
          • Stocks We Review
        • STOCK CHARTS
          • Key Components
          • Reading Charts
          • Drawing Stock Charts
          • Identifying Trends
  • About
    • Contact Us
    • How to Win
    • #1 At Stockcharts
    • Disclaimer
    • FAQ
  • Log In
  • Subscribe

December 17, 2017

Green Line Weekly Dec 17, 2017

DOW Chart

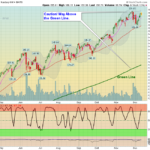
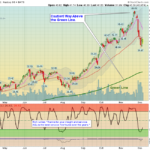
  12/17/2017:  Markets were higher for the week, with the Dow and the S&P hitting all-time highs and gaining about 1% each for the week. Stocks jumped after changes were made to the tax reform bill and Markets are expecting the votes to … [Read more...]

December 15, 2017

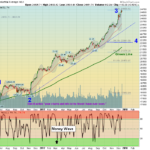
Money Wave Alert! Dec 15, 2017

BA Chart

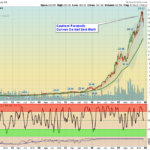
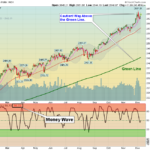
  It is amazing how the Major Indices are on Highs, and very few individual Stocks are.  The DOW and S&P 500 were able to bounce near their Pink Lines (10-day avgs) yesterday and rally today. Most Leading Investments are in the Red … [Read more...]

December 14, 2017

Money Wave Alert! Dec 14, 2017

SPX Chart

  Markets  are down slightly today on mild selling.  The DOW and S&P 500 made higher Highs yesterday, and should bounce near their Pink Lines (10-day avgs).  Most Leading Investments are in the Red Zone (probably too late to Buy for … [Read more...]

December 13, 2017

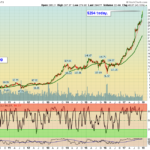
Money Wave Alert! Dec 13, 2017

GBTC Fund

  Markets  are up again today while the FED raised interest rates another 1/4 point.  The DOW and S&P 500 have been able to make higher Highs than last week.  Most Leading Investments are in the Red Zone (probably too late to Buy for … [Read more...]

December 12, 2017

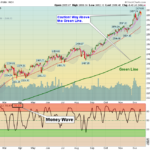
Money Wave Alert! Dec 12, 2017

QQQ Chart

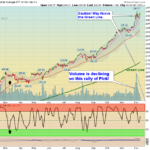
  Markets  are mostly up again today as the major Indices are back up near Highs. The DOW and S&P 500 have been able to go slightly higher than last week.  The Volume is not good. Please have Sell Stops below recent Short Term … [Read more...]

December 11, 2017

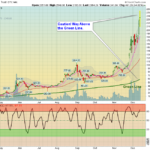
Money Wave Alert! Dec 11, 2017

DIA Chart

  Markets  are up again today as the major Indices are back up near Highs. The DOW and S&P 500 bounced off their Pink Lines (10-day avgs.) but must make New Highs for this rally to continue.  Please have Sell Stops below recent Short Term … [Read more...]

December 10, 2017

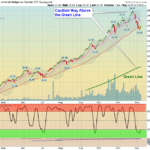
Green Line Weekly Dec 10, 2017

NVDA CHART

  12/10/2017:  Markets were higher for the week, with the Dow and the S&P hitting all-time highs and gaining about 0.4% each for the week. The Nasdaq fell 0.1%, as the rotation out of some of the tech high-fliers continued. Consumer … [Read more...]

December 8, 2017

Money Wave Alert! Dec 8, 2017

SPX Chart

  Markets  have bounced up, but the Money Wave Pops from yesterday are weak so far. This indicates a lack of Buyers, as the major Indices are back up near Highs. Please have Sell Stops below recent Short Term purchases. The DOW and S&P … [Read more...]

December 7, 2017

Money Wave Alert! Dec 7, 2017

BOTZ Chart

  Markets  are up slightly today with the Techs moving back up. There are several Money Wave Buys today ... The DOW, S&P 500 and Small Caps are trying to bounce off their Pink Lines (10-day avgs.). Many Techs and Semiconductors are … [Read more...]

December 6, 2017

Money Wave Alert! Dec 6, 2017

MU Chart

  Markets  are mixed today with the Techs up slightly, but not enough Buying to trigger many Money Wave Buys today ... The DOW, S&P 500 and Small Caps are trying to bounce off their Pink Lines (10-day avgs.) but need some News to create … [Read more...]

  • « Previous Page
  • 1
  • …
  • 508
  • 509
  • 510
  • 511
  • 512
  • …
  • 559
  • Next Page »

Subscribe to Our Newsletter

AGL Logo

Get our eBook Now!

Candlestick - A Swing Traders Friend

We don’t spam! Read our privacy policy for more info.

You’ve been successfully subscribed to our newsletter!

Voted #1 at Stock Charts

SH Chart
Inverse S&P 500 Fund (SH) will have a Money Wave Buy today.

Help Us Help Animals

Help Us Help Animals

Recent Comments

  • ATGL Weekly Money Flow - 2026-02-08 on ATGL Top Pick of the Week! Jan 25, 2026
  • ATGL Weekly Money Flow - 2026-01-25 on ATGL Top Pick of the Week! Jan 11, 2026
  • ATGL Weekly Money Flow - 2025-12-28 on ATGL Top Pick of the Week Dec 21, 2025
  • Inside Bar Trading Strategy: Improve Timing and Wins on Price Action Trading: Mastering the Art of Reading the Market Without Indicators
  • Breakaway Gap Explained: Identify High-Probability Setups on Identifying Market Exhaustion Signals for Smarter Trading Decisions

Become a Green Liner!

Help me make more Money in the Stock Market.

ON ATGL

  • DashBoard
  • Weekly Commentary
  • Daily Buy / Sell Signals
  • Day Trade Setup
  • Trading Rooms

Design & Develop By Pixelvect

STRATEGIES

  • Swing Trading
  • ATGL Pick of the Week
  • Dividend Growth
  • ETF Sector Rotation
  • Dogs of the Dow

HELP

  • ATGL Trading Rules
  • FAQ
  • Account Maintenance
  • Contact US
  • Join

FOLLOW US

Instagram Linkedin Twitter Facebook

© COPYRIGHT 2024 · ABOVETHEGREENLINE.COM · ALL RIGHTS RESERVED · PRIVACY · TERMS · CONTACT · WATCHLIST · CURRENT