Above the Green Line -01
  • Market Insights
        • Commentary
          • Daily
          • Weekly
        • BUY / SELL SIGNALS
          • Trade Posts
          • Recent Trade Alerts
          • Recent Day Trades
        • BLOGROLL
          • Dividend Growth Blog
          • ETF Sector Blog
          • Dow Dogs
          • TPOW Blog
  • Strategies
        • SWING TRADING
          • Current Positions
          • Watchlists
          • Closed Positions
          • Candidates - TOP 100
          • Specialty Stocks
        • WEEKLY STOCK PICK
          • TPOW Charts
          • TPOW Performance
          • TPOW Strategy Guide
          • TPOW Performance Dashboard
          • Why Weekly Trading Works
        • DAY TRADING
          • Watch List
        • ATGL DASHBOARD
        • ETF STRATEGIES
          • ETF Sector Rotation
          • ETF Sector Portfolio
        • DIVIDEND GROWTH
          • Dividend Growth Portfolio
          • Dividend Calendar
        • DOGS OF THE DOW
          • Dogs of the Dow Portfolio
          • DOW 5 Portfolio
  • Markets
        • US MARKET
          • Commodities
          • Energy
          • Precious Metals
          • Volatility
        • GLOBAL MARKETS
          • Market Indices
          • Economic Calendar
          • FOREX Heat Map
          • FOREX Cross Rates
          • Crypto Currency Market
  • Investing
    • Discord Community
    • Dashboard
  • Resources
        • INVESTING GUIDES
          • Dividend Growth Guide
          • Investment Strategy Framework
          • ETF Investing Handbook
          • Stock Trading Handbook
        • ARTICLES
          • Dividend Growth Model Articles
          • ETF Articles
          • Investment Strategies Articles
          • Market and Economic Insights
          • Stock Trade Articles
          • Stock Reviews
        • TOOLS
          • Stock Scanners
          • Charting Software
          • Brokerage Firms
          • Stocks We Review
        • STOCK CHARTS
          • Key Components
          • Reading Charts
          • Drawing Stock Charts
          • Identifying Trends
  • About
    • Contact Us
    • How to Win
    • #1 At Stockcharts
    • Disclaimer
    • FAQ
  • Log In
  • Subscribe

January 11, 2018

Money Wave Alert! Jan 11, 2018

RIOT Chart

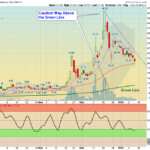
Crypto Stocks are coming Down for a Bounce!   (1/2 Price)   Markets were higher today, as the major Indices all made New Highs.  More curving up from Buying. The S&P 500 has Support at the Pink Line of 2725 (10-day avg.).   Most … [Read more...]

January 10, 2018

Money Wave Alert! Jan 10, 2018

XLK Chart

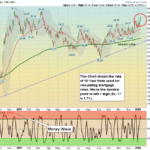
  Markets were down slightly today, as the Techs are tired and Over-Bought.  The S&P 500 has Support at the Pink Line of 2716 (10-day avg.).   Yields on the 10-Year Note have popped up more today (2.59% Yield) on Economic Recovery … [Read more...]

January 9, 2018

Money Wave Alert! Jan 9, 2018

TNX Chart

  Markets were up today, on Buying of the Very Strongest Leaders.  The S&P 500 has Support at the Pink Line of 2710 (10-day avg.).   Yields on the 10-Year Note have popped up 2.6% today (2.55% Yield) on Economic Recovery Hopes. Most … [Read more...]

January 8, 2018

Money Wave Alert! Jan 8, 2018

Botz Chart

  Markets were mixed today, after last week's big rally to New Highs.  The S&P 500 has Support at the Pink Line of 2703 (10-day avg.).   Most Leading Funds are up near the Red Zones. Please wait for the Money Wave Indicators to return … [Read more...]

January 7, 2018

Green Line Weekly Jan 7, 2018

NYA Chart

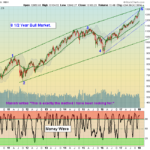
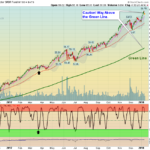
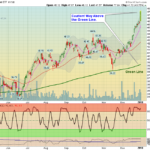
  01/07/2018:  Markets rallied another 2% as Investors are hoping for higher profits. Volume was lower on the Holiday week. Not much should change until the Commodity Index breaks out above 196.36 to the upside. The Bond Market watches … [Read more...]

January 5, 2018

Money Wave Alert! Jan 5, 2018

CANN Chart

  Markets were up every day this week making New Highs.  No Sellers, just a Buying Stampede as the news is all Good!  The S&P 500 has Support at the Pink Line of 2696 (10-day avg.).   Most Leading Funds are up near the Red Zones. … [Read more...]

January 4, 2018

Money Wave Alert! Jan 4, 2018

DIA Chart

  Markets are up again today making New Highs.  No Sellers, as the news is all Good!  The S&P 500 has Support at the Pink Line of 2690 (10-day avg.).   Most Leading Funds are up near the Red Zones. Please wait for the Money Wave … [Read more...]

January 3, 2018

Money Wave Alert! Jan 3, 2018

QQQ Chart

  Markets are making New Highs again today as the Buying Stampede continues... Not many reasons to Sell other than Over-Bought, so most are holding for more. The S&P 500 bounced back above the Pink Line of 2683 (10-day avg.) to avoid a … [Read more...]

January 2, 2018

Money Wave Alert! Jan 2, 2018

SLX Chart

  Markets are higher today but the Volume is Low. The S&P 500 is back above the Pink Line of 2683 (10-day avg.) to avoid a Short Term Sell Signal.   Most Leading Funds are up near the Red Zones. Please wait for the Money Wave … [Read more...]

December 31, 2017

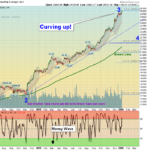
Green Line Weekly Dec 31, 2017

SPX Chart

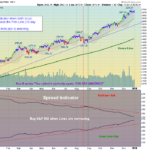
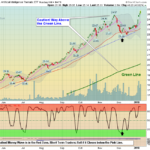
  12/31/2017:  Markets had a historic up move this year, with the Major Indices up more than 20%!  Historically, Investment results are better if you "Buy & Hold" during a strong up move, instead of Trading the move. But If you are … [Read more...]

  • « Previous Page
  • 1
  • …
  • 506
  • 507
  • 508
  • 509
  • 510
  • …
  • 559
  • Next Page »

Subscribe to Our Newsletter

AGL Logo

Get our eBook Now!

Candlestick - A Swing Traders Friend

We don’t spam! Read our privacy policy for more info.

You’ve been successfully subscribed to our newsletter!

Voted #1 at Stock Charts

SH Chart
Inverse S&P 500 Fund (SH) will have a Money Wave Buy today.

Help Us Help Animals

Help Us Help Animals

Recent Comments

  • ATGL Weekly Money Flow - 2026-02-08 on ATGL Top Pick of the Week! Jan 25, 2026
  • ATGL Weekly Money Flow - 2026-01-25 on ATGL Top Pick of the Week! Jan 11, 2026
  • ATGL Weekly Money Flow - 2025-12-28 on ATGL Top Pick of the Week Dec 21, 2025
  • Inside Bar Trading Strategy: Improve Timing and Wins on Price Action Trading: Mastering the Art of Reading the Market Without Indicators
  • Breakaway Gap Explained: Identify High-Probability Setups on Identifying Market Exhaustion Signals for Smarter Trading Decisions

Become a Green Liner!

Help me make more Money in the Stock Market.

ON ATGL

  • DashBoard
  • Weekly Commentary
  • Daily Buy / Sell Signals
  • Day Trade Setup
  • Trading Rooms

Design & Develop By Pixelvect

STRATEGIES

  • Swing Trading
  • ATGL Pick of the Week
  • Dividend Growth
  • ETF Sector Rotation
  • Dogs of the Dow

HELP

  • ATGL Trading Rules
  • FAQ
  • Account Maintenance
  • Contact US
  • Join

FOLLOW US

Instagram Linkedin Twitter Facebook

© COPYRIGHT 2024 · ABOVETHEGREENLINE.COM · ALL RIGHTS RESERVED · PRIVACY · TERMS · CONTACT · WATCHLIST · CURRENT