Above the Green Line -01
  • Market Insights
        • Commentary
          • Daily
          • Weekly
        • BUY / SELL SIGNALS
          • Trade Posts
          • Recent Trade Alerts
          • Recent Day Trades
        • BLOGROLL
          • Dividend Growth Blog
          • ETF Sector Blog
          • Dow Dogs
          • TPOW Blog
  • Strategies
        • SWING TRADING
          • Current Positions
          • Watchlists
          • Closed Positions
          • Candidates - TOP 100
          • Specialty Stocks
        • WEEKLY STOCK PICK
          • TPOW Charts
          • TPOW Performance
          • TPOW Strategy Guide
          • TPOW Performance Dashboard
        • DAY TRADING
          • Watch List
        • ATGL DASHBOARD
        • ETF STRATEGIES
          • ETF Sector Rotation
          • ETF Sector Portfolio
        • DIVIDEND GROWTH
          • Dividend Growth Portfolio
          • Dividend Calendar
        • DOGS OF THE DOW
          • Dogs of the Dow Portfolio
          • DOW 5 Portfolio
  • Markets
        • US MARKET
          • Commodities
          • Energy
          • Precious Metals
          • Volatility
        • GLOBAL MARKETS
          • Market Indices
          • Economic Calendar
          • FOREX Heat Map
          • FOREX Cross Rates
          • Crypto Currency Market
  • Investing
    • Discord Community
    • Dashboard
  • Resources
        • ARTICLES
          • Dividend Growth Model Articles
          • ETF Articles
          • Investment Strategies Articles
          • Market and Economic Insights
          • Stock Trade Articles
          • Stock Reviews
        • TOOLS
          • Stock Scanners
          • Charting Software
          • Brokerage Firms
        • STOCK CHARTS
          • Key Components
          • Reading Charts
          • Drawing Stock Charts
          • Identifying Trends
        • RETIREMENT PLANNING
  • About
    • Contact Us
    • How to Win
    • #1 At Stockcharts
    • Disclaimer
    • FAQ
  • Log In
  • Subscribe

January 7, 2018

Green Line Weekly Jan 7, 2018

NYA Chart

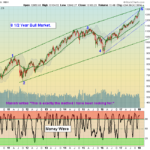
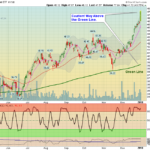
  01/07/2018:  Markets rallied another 2% as Investors are hoping for higher profits. Volume was lower on the Holiday week. Not much should change until the Commodity Index breaks out above 196.36 to the upside. The Bond Market watches … [Read more...]

January 5, 2018

Money Wave Alert! Jan 5, 2018

CANN Chart

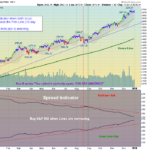
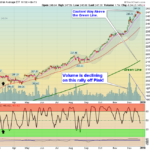
  Markets were up every day this week making New Highs.  No Sellers, just a Buying Stampede as the news is all Good!  The S&P 500 has Support at the Pink Line of 2696 (10-day avg.).   Most Leading Funds are up near the Red Zones. … [Read more...]

January 4, 2018

Money Wave Alert! Jan 4, 2018

DIA Chart

  Markets are up again today making New Highs.  No Sellers, as the news is all Good!  The S&P 500 has Support at the Pink Line of 2690 (10-day avg.).   Most Leading Funds are up near the Red Zones. Please wait for the Money Wave … [Read more...]

January 3, 2018

Money Wave Alert! Jan 3, 2018

QQQ Chart

  Markets are making New Highs again today as the Buying Stampede continues... Not many reasons to Sell other than Over-Bought, so most are holding for more. The S&P 500 bounced back above the Pink Line of 2683 (10-day avg.) to avoid a … [Read more...]

January 2, 2018

Money Wave Alert! Jan 2, 2018

SLX Chart

  Markets are higher today but the Volume is Low. The S&P 500 is back above the Pink Line of 2683 (10-day avg.) to avoid a Short Term Sell Signal.   Most Leading Funds are up near the Red Zones. Please wait for the Money Wave … [Read more...]

December 31, 2017

Green Line Weekly Dec 31, 2017

SPX Chart

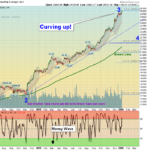
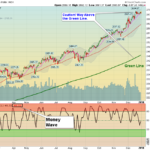
  12/31/2017:  Markets had a historic up move this year, with the Major Indices up more than 20%!  Historically, Investment results are better if you "Buy & Hold" during a strong up move, instead of Trading the move. But If you are … [Read more...]

December 29, 2017

Money Wave Alert! Dec 29, 2017

SPX Cjart

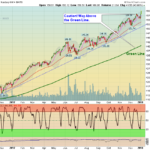
S&P 500 is Holding just Above the Pink Line.   Markets are down slightly today on more slow holiday trading. The S&P 500 is holding just above the Pink Line of 2682 (10-day avg.) to avoid a Short Term Sell Signal.   The Mutual … [Read more...]

December 28, 2017

Money Wave Alert! Dec 28, 2017

Snow Pic

  Markets are up slightly today on slow holiday trading. The Mutual Funds want to hold the Markets up to get bigger bonuses. You will have to WAIT for more Money Wave Buys.  The major Indices are still holding above their Pink Lines … [Read more...]

December 27, 2017

Money Wave Alert! Dec 27, 2017

DBC Chart

    Markets were mixed today on more slow holiday trading. The Markets won't drop yet, so there are very few Money Wave Buys. (Please WAIT). The major Indices are still holding above their Pink Lines (10-day avgs.) to avoid Short … [Read more...]

December 26, 2017

Money Wave Alert! Dec 26, 2017

DIA Chart

  Markets were down slightly today on slow holiday trading. Money Wave bounces are poor, and the Volume is Low. The major Indices are still holding above their Pink Lines (10-day avgs.) to avoid Short Term Sell Signals. Pajama Boys are in … [Read more...]

  • « Previous Page
  • 1
  • …
  • 440
  • 441
  • 442
  • 443
  • 444
  • …
  • 493
  • Next Page »

Subscribe to Our Newsletter

AGL Logo

Get our eBook Now!

Candlestick - A Swing Traders Friend

We don’t spam! Read our privacy policy for more info.

You’ve been successfully subscribed to our newsletter!

Voted #1 at Stock Charts

SH Chart
Inverse S&P 500 Fund (SH) will have a Money Wave Buy today.

Help Us Help Animals

Help Us Help Animals

Recent Comments

  • Breakout Trading Strategies That Can Boost Your Gains on 7 Day Trading Strategies for New Investors
  • What the Descending Staircase Pattern Tells You About the Market on Bull vs. Bear Market: An Investor’s Guide to Market Phases
  • Want to Protect Your Capital? Start With Better Position Sizing on Risk Management in Trading: Tools and Techniques
  • Want to Protect Your Capital? Start With Better Position Sizing on Swing Trading Risk Management: Tips To Safeguard Your Profits
  • Price Action Trading Strategies That Work in Any Market on What Is a Death Cross in Stocks? A Bearish Market Signal

Become a Green Liner!

Help me make more Money in the Stock Market.

ON ATGL

  • DashBoard
  • Weekly Commentary
  • Daily Buy / Sell Signals
  • Day Trade Setup
  • Trading Rooms

Design & Develop By Pixelvect

STRATEGIES

  • Swing Trading
  • ATGL Pick of the Week
  • Dividend Growth
  • ETF Sector Rotation
  • Dogs of the Dow

HELP

  • ATGL Trading Rules
  • FAQ
  • Account Maintenance
  • Contact US
  • Join

FOLLOW US

Instagram Linkedin Twitter Facebook

© COPYRIGHT 2024 · ABOVETHEGREENLINE.COM · ALL RIGHTS RESERVED · PRIVACY · TERMS · CONTACT · WATCHLIST · CURRENT