Investment Ideas (Not Green Line Rules)
An excellent way to improve your trading skills is to see what others are doing. Per TradingView, Trade ideas can come in many forms whether it be predictions, market analyses or trade set-ups based on concrete market conditions. Ideas can also contain educational material and show how trading methods, analysis approaches or tools exactly work. There are many areas of technical analysis, some are basic, others more sophisticated and all are supported with intelligent drawing tools, many bar styles, lots of data and a host of indicators.
Ideas can relate to any asset class like currencies, stocks or futures or any trading method like harmonic patterns, wave analysis or chart patterns. Often traders use a combination of several methods and look for confluence and increase their odds. There are also ideas on risk management, trading psychology and trading plans. Regardless of the method you use, it’s indisputable that the cycle of creating, sharing, collaborating and learning based on well-thought-out ideas will help you improve your trading skills.
Below are some current Ideas for US Stocks. If you have any questions or comments please feel free to leave a message in our forum. We are always interested to hear what you have to say.
-
BTCUSDT.P – Rejection From Supply Zone, Potential Drop Toward 62
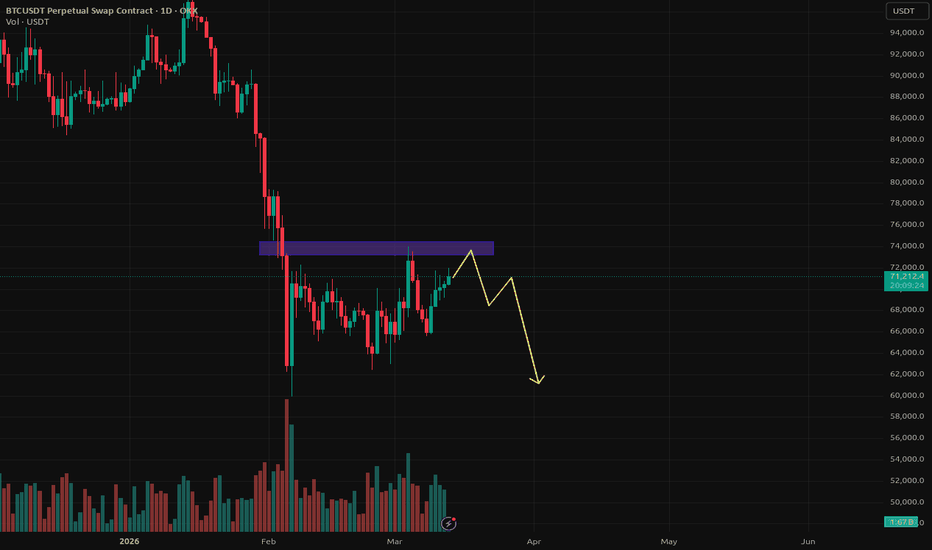 Price is approaching a strong supply zone around 73K–75K. If we see rejection in this area, short positions could be considered. Potential downside targets: 68K – 65K – 62K. Invalidation if price breaks and holds above 75K. #SmartMoney #Liquidity #Noliquid #MarketStructure... Read more
 -
Silver / U.S. Dollar (XAG/USD) — 15M Technical Analysis
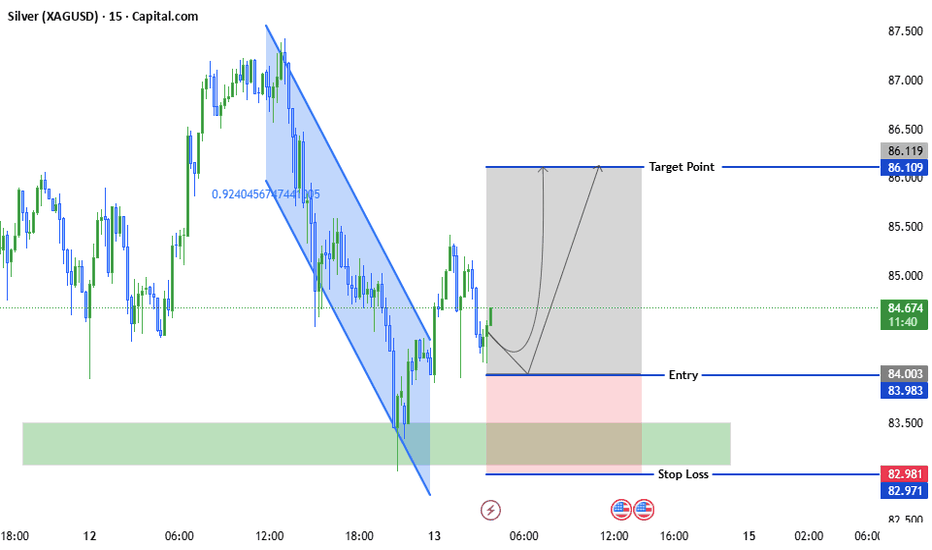 Price previously moved inside a clear descending channel, showing strong bearish momentum. The market then broke out of the channel and created a strong bounce. After the bounce, price is pulling back toward a demand/support zone. This indicates a possible trend shift or bullish retracement opportunity. Key Demand Zone The green area around 83.40 – 83.60 represents a strong demand zone where buyers previously stepped in. Reasons this zone is important: Previous liquidity sweep Support reaction area Institutional accumulation zone Trade Setup Potential Buy Setup Entry: 84.00 Stop Loss: 82.98 Target: 86.10 This gives approximately 1:2 risk-to-reward, which is a healthy intraday setup.... Read more
 -
KEC-BUY
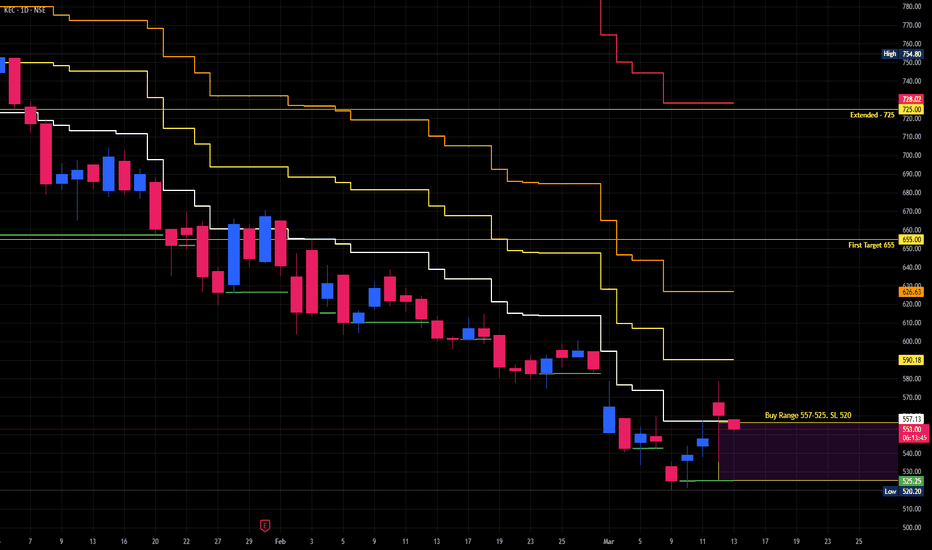 Please stick to levels on charts. Please trigger target and SL. For Extended Target carry 25% of Original Position.... Read more
 -
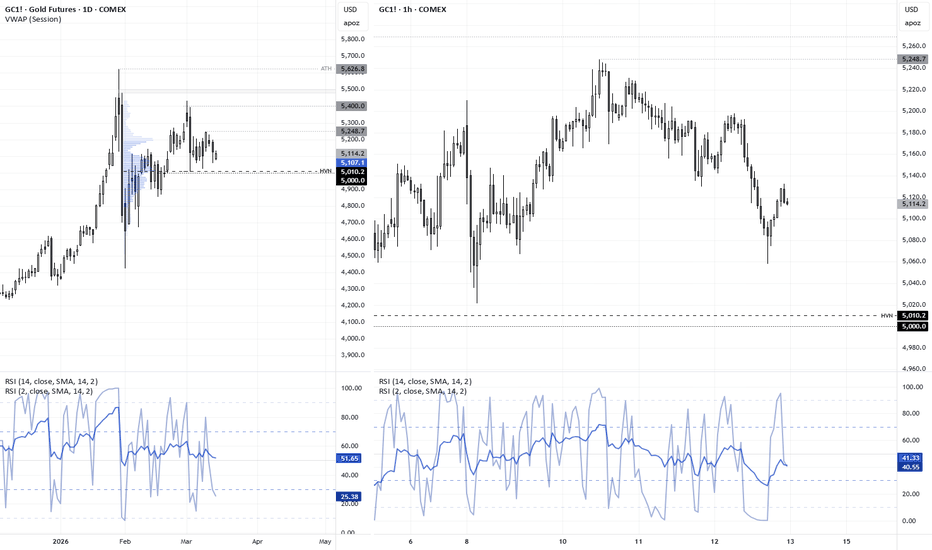
Gold for the Bears (Intraday Trade Opportunity)
 As gold continues to consolidate and the DXY gaining value, a short opportunity presents itself for an intraday trade. Expecting TP1 - 5060 and TP2 - 5015.50 and Stop Loss at or above price 5140. Please utilize trailing stop loss after TP1 is achieved. Let's see how this plays out.... Read more
 -
TCS -MTF Strong SELL with potential relief bounce
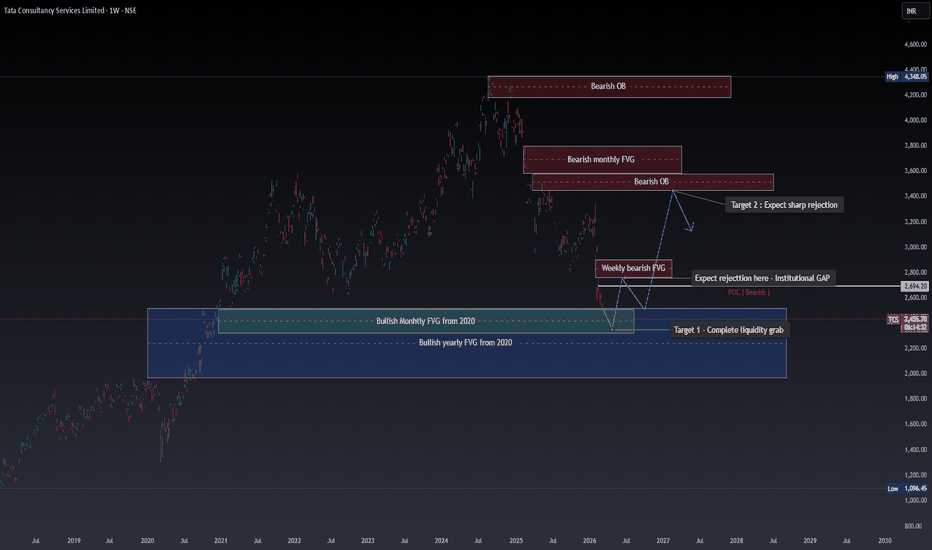 TCS is currently showing broad bearish alignment across all major timeframes. Price has been trending lower after rejecting a major higher-timeframe supply zone, indicating strong institutional selling pressure. The structure has shifted from an uptrend to a clear sequence of lower highs and lower lows, confirming a sustained bearish phase. As price approaches deeper historical liquidity zones, the market may complete a liquidity sweep before a temporary recovery. Multi-Timeframe Perspective Weekly Timeframe: Price rejected a major supply zone around ₹4,200 – ₹4,350. Since that rejection, the structure has shifted into a bearish trend with consistent lower highs forming. Intermediate Structure: Momentum continues to favor sellers. The market has failed to reclaim previous resistance levels, reinforcing downside continuation. Lower Timeframes: Shorter timeframes remain aligned with the broader trend, showing persistent selling pressure and continuation of the bearish structure. When all timeframes align in the same direction, it typically reflects sustained institutional... Read more
 -
XAGUSD H1 BUYING 81.000 TO 80.000 SELLING 87.000 TO 89.000
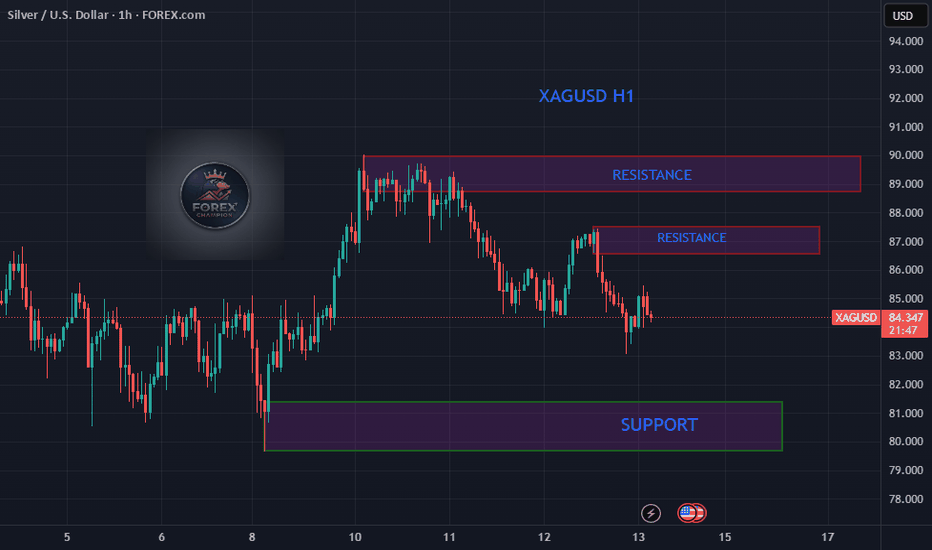 Two resistance areas are marked on the chart with red rectangles: Upper resistance zone around 88.5 – 89.5 Lower resistance zone around 86.5 – 87 These zones represent areas where: Sellers previously entered the market Price may reverse downward again if it reaches these levels. 🟢 Support Zone A support area is marked lower on the chart (green rectangle) around approximately 80 – 81. This is a level where: Buyers previously stepped in Price may bounce upward if it drops to that zone. 📉 Current Price The current price shown on the right side is approximately 84.35 USD. 📋 Watchlist (Right Panel) The trading platform watchlist includes: DXY Ethereum XAU/USD USD/JPY EUR/USD XAG/USD 🧭 Overall Interpretation The market is in a bearish structure with lower highs and lower lows. Price is currently between resistance and support, meaning the market is in a range/pullback phase. ✅ If you want, I can... Read more
 -
$HYPE - Range Play
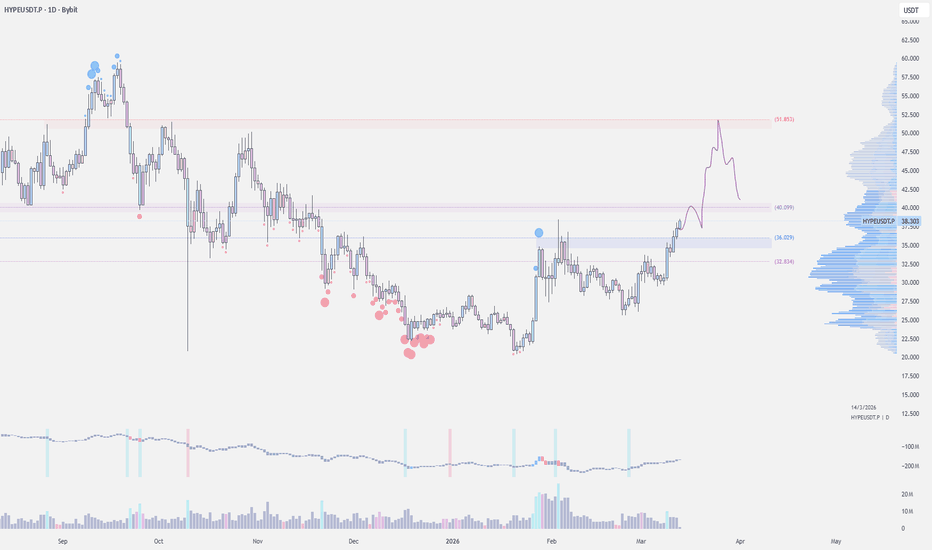 KUCOIN:HYPEUSDT | 1D Could see price push into $40–44, likely some reaction there since that zone previously acted as support before the breakdown. If $35–36 holds, could see it retesting $45–48, maybe even $52–54 (range high retest) on extension. For now, watching r1 $40–44 key support: s1 = $35-36 key resistance: r1 - $40–44 r2 - $45–48 r3 - $52–54... Read more
 -
USD/JPY, CHF/JPY, Gold
 A technical look at key levels and possible scenarios for yen and gold traders. MS... Read more
 -
Gold Price Prediction – Technical & Fundamental Outlook
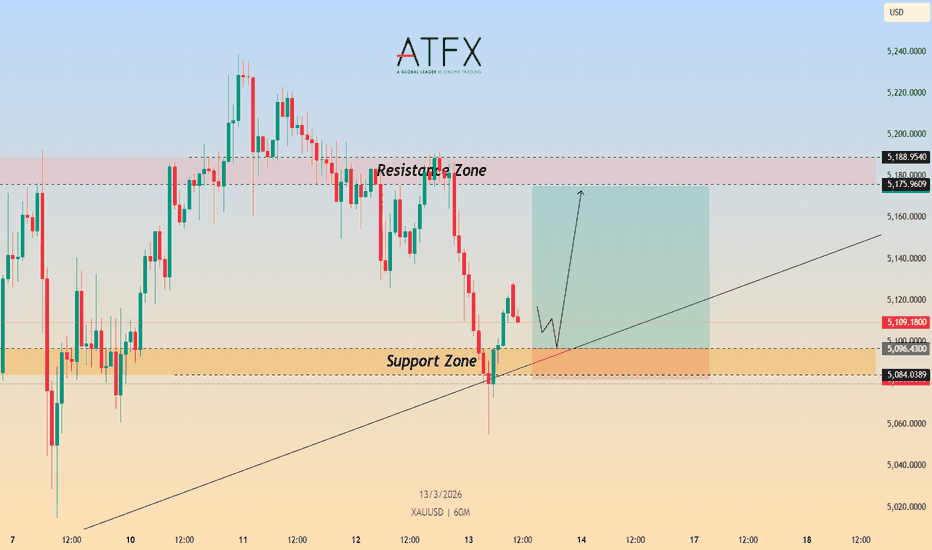 📊 Technical Analysis (XAU/USD) PEPPERSTONE:XAUUSD On the 60-minute (60M) chart dated March 13, 2026, Gold (XAU/USD) is currently under technical pressure, slumping to approximately $5,090 during the early Asian session. The price action has broken below the $5,100 psychological level and is now actively testing a high-confluence Support Zone between $5,084.03 – $5,096.43. This zone is critically reinforced by a major ascending trendline that has historically served as a floor for the metal's primary uptrend. The technical structure highlights a firm Resistance Zone situated between $5,175.96 – $5,188.95. While the immediate bias is bearish, the metal's current position near the trendline support suggests a potential technical bounce if buyers can defend this level ahead of high-impact US data. Short-term bias: Bearish while below $5,175; neutral/bullish if the trendline support holds. Key Resistance: $5,175.96 – $5,188.95. Key Support: $5,084.03 – $5,096.43. 🎯 Trade Setup (Support Bounce Scenario) Entry Zone: $5,085 –... Read more
 -
NIFTY 50 Futures – Multi-Timeframe liquidity grabs .WATCH !!!
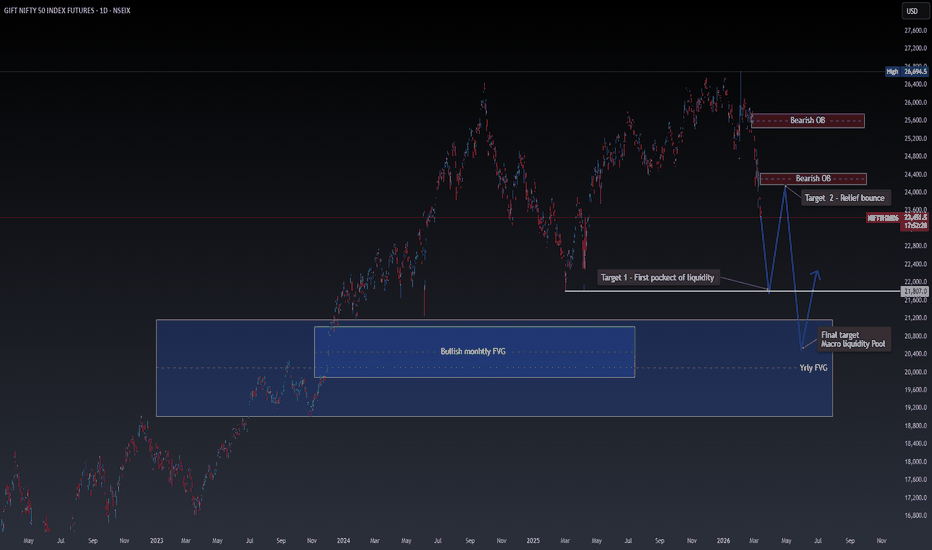 NIFTY futures are currently showing broad multi-timeframe weakness, with price reacting strongly from a higher-timeframe supply zone. The rejection from this area suggests institutional distribution and growing selling pressure across multiple timeframes. Recent price action indicates a loss of bullish momentum, with the market beginning to rotate toward lower liquidity zones. Multi-Timeframe Perspective Daily Timeframe :Price rejected a bearish Order Block, indicating supply dominance at higher levels. Market structure shows loss of upside continuation after failing to sustain new highs. Intermediate Timeframe :Momentum indicators and trend structure suggest continued downside pressure as sellers remain active. Lower Timeframes :Price is forming lower highs with expanding downside impulses, reinforcing the broader bearish bias. This alignment across multiple timeframes suggests that selling pressure is not isolated but part of a broader distribution phase. Key Technical Observations 1.Bearish Reaction from Institutional Supply Price reacted from a bearish Order Block zone, often associated with institutional... Read more
 -
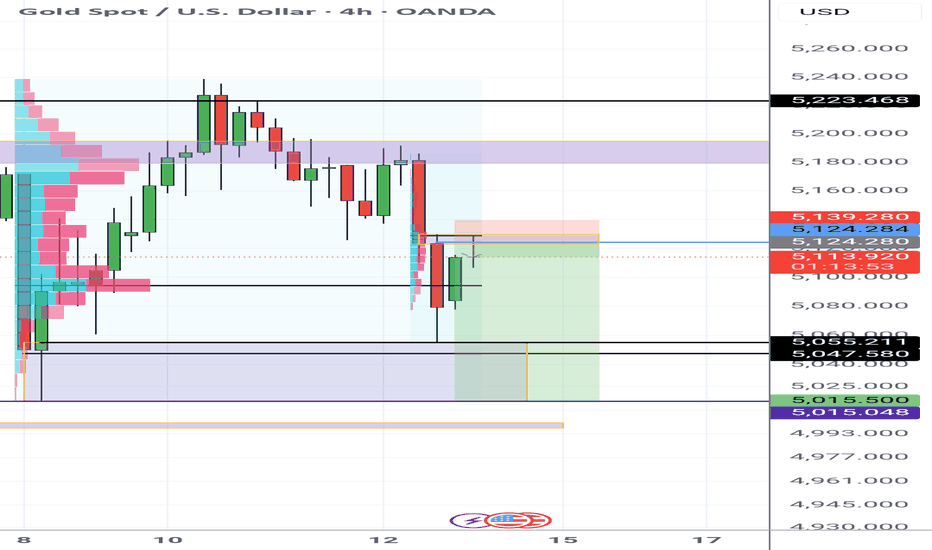
XAU/USD Retesting Resistance — Sellers Target 5045
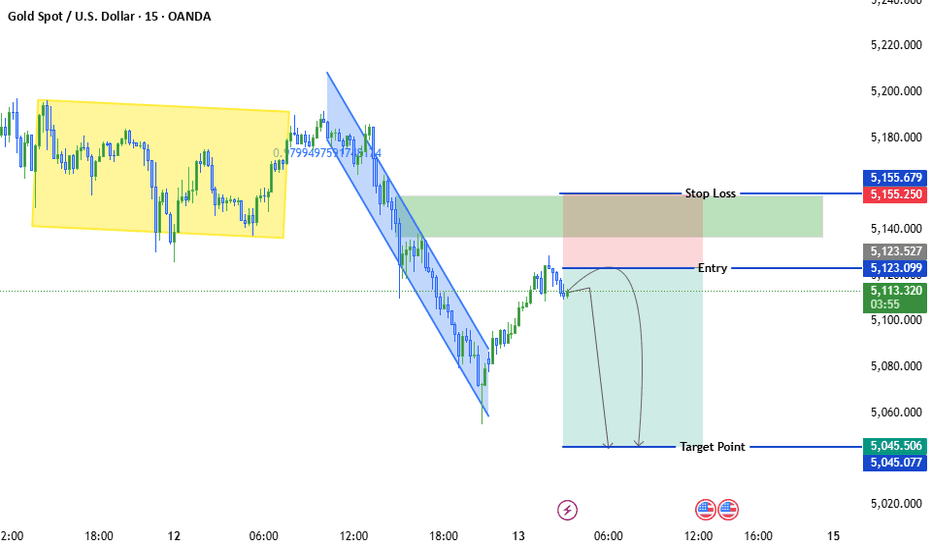 Price previously moved inside a sideways accumulation range (yellow box). A strong bearish breakout occurred from that range. After the breakout, price formed a descending channel showing strong selling pressure. The market then made a retracement upward toward a supply zone. This suggests the move is likely a bearish continuation after a pullback. Key Trading Zone Entry Area: ~ 5123 This level aligns with: Previous intraday support turned resistance Channel retest Liquidity pullback area Smart money often sells from these retracement zones. Trade Idea Sell Setup Entry: 5123 Stop Loss: 5155 Target: 5045 Risk-to-Reward is roughly 1:2.5, which is solid for an intraday setup.... Read more
 -
Global Workspace Control for Multi-Layout Chart Management
 Section 1 — Summary Feature Request: Global Workspace Command for Multi-Layout Control Background TradingView is one of the most powerful charting platforms available today. However, for users who work with multiple layouts and multi-timeframe analysis, managing charts across many layouts becomes inefficient and repetitive. Currently, most synchronization features (symbol sync, timeframe sync, crosshair sync, drawing sync) only work within a single layout. There is no global command that can control elements across all layouts in a workspace. This limitation creates significant workflow friction for advanced users. --- Problem Many traders use multiple layouts for structured analysis. For example: Layout A MN / W / D / H4 Layout B H1 / M15 / M5 Layout C Different symbol but same timeframes When a user needs to change a setting such as: • Chart type (Candlestick → Line) • Symbol • Indicator • Visual settings the change must be applied manually... Read more
 -
Gold Rebound After Strong Drop — Selling the Rally
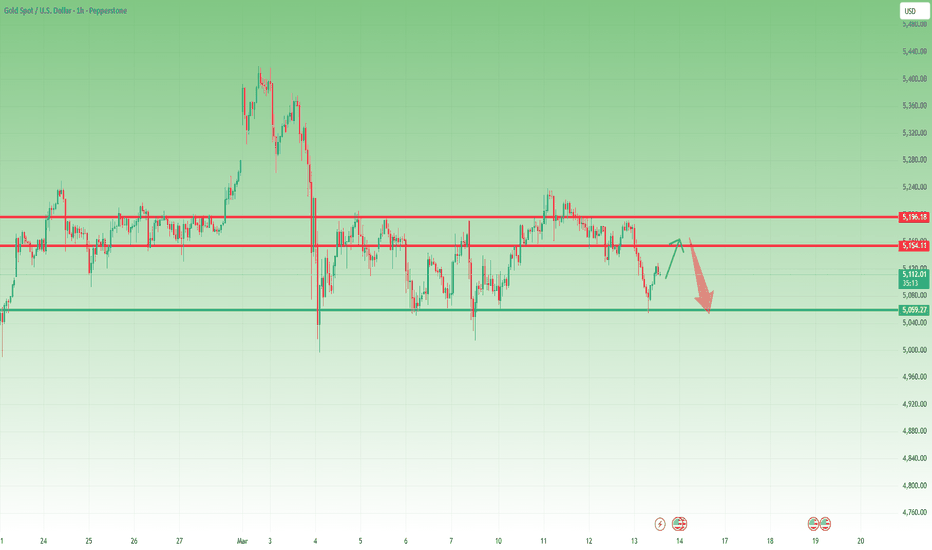 Yesterday turned out to be a very good day for Gold bears, myself included. The session started with Gold pushing once again into the resistance area, repeating the pattern we’ve seen several times recently. However, instead of breaking higher, the market began to slow down and consolidate near the top, a behavior that often signals distribution rather than accumulation. After this short consolidation phase, sellers stepped in decisively. What followed was eight consecutive hours of bearish price action, driving the market steadily lower until it returned to the support zone. For my position, this move resulted in a 1200-pip profit, capturing almost the entire daily range — the kind of move traders always aim for but rarely manage to catch so cleanly. Reaction from Support Once the market reached support, a technical rebound naturally followed. That reaction was expected, as markets rarely move in one direction without pauses, especially after... Read more
 -
Bitcoin: Recovery Momentum Expands, Price May Target 72,500
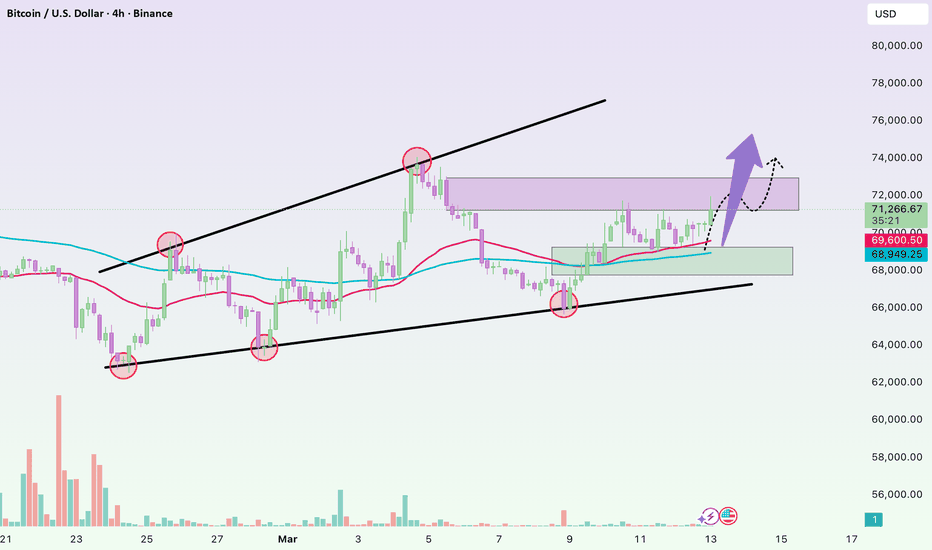 Hello everyone, Looking at the BTC/USD chart on the H4 timeframe, the market appears to be stabilizing after the previous corrective phase. Bitcoin is currently trading around 71,100 USD and holding above two key moving averages, suggesting that the short-term structure is gradually turning more constructive. Earlier, Bitcoin rallied strongly toward the 73,000 USD area before quickly pulling back as profit-taking emerged. However, instead of extending the decline, price formed a relatively clear consolidation zone around 68,500–70,000 USD. This area is now acting as a structural support zone for the short-term trend. At the moment, the fact that price continues to hold above the moving averages and is printing higher lows indicates that buying pressure may be gradually returning. Trading volume has also started to stabilize after the earlier volatility spike, reflecting a market that is beginning to rebalance sentiment. Based on the current technical structure, my base scenario is... Read more
 -
GOLD –The market is consolidating, awaiting a decisive breakout!
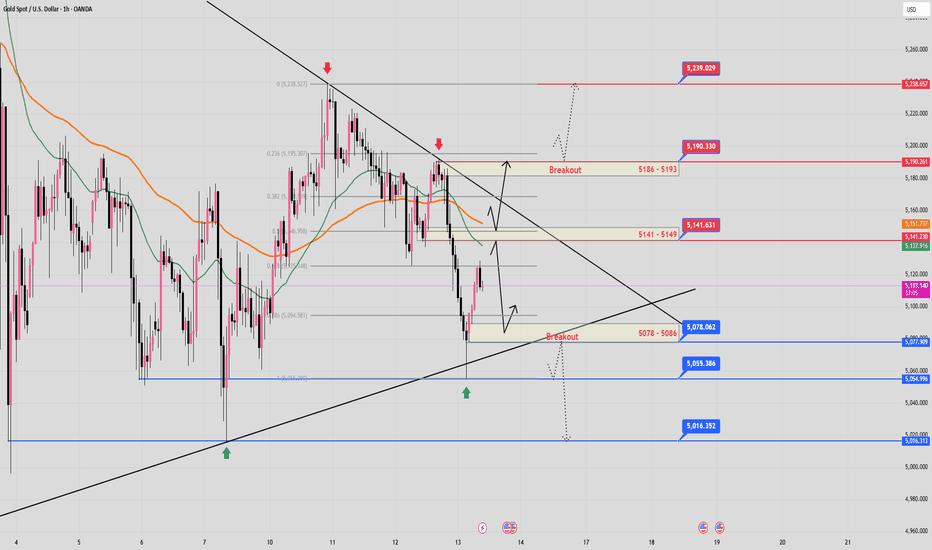 - After a sharp decline from the resistance zone (5186 - 5193), the price is currently moving within a converging triangle pattern between the descending and ascending trendlines. This is typically a period of liquidity consolidation before a strong breakout to determine the next trend. - The EMA (H4) maintains a medium-term uptrend structure as EMA 34 remains above EMA 89. However, the EMA (H2 - H1 - M30) indicates a short-term downtrend as EMA 34 is below EMA 89; the timeframes are not converging on the structure. - The (5186 - 5193) zone is currently a crucial resistance area; a breakout of this zone would lead to a stronger upward momentum. The (5078 - 5086) zone is currently a crucial support area; a breakout of this zone would open up a wider downward movement in the market. ✅ VIEW: 1. BUY SCENARIO: - If the price breaks through the... Read more

Related Articles

Margin Call Explained: What Triggers It and How to Avoid One

AMC Short Squeeze Explained: Timeline, Causes, and Trading Risks

DBC ETF Guide: Is This Commodity Fund Worth the Risk?

XBI ETF Explained: Is This Biotech Fund a Smart Buy in 2026?

How to Use Net Present Value (NPV) for Dividend Stocks