Above the Green Line -01
  • Market Insights
        • Commentary
          • Daily
          • Weekly
        • BUY / SELL SIGNALS
          • Trade Posts
          • Recent Trade Alerts
          • Recent Day Trades
        • BLOGROLL
          • Dividend Growth Blog
          • ETF Sector Blog
          • Dow Dogs
          • TPOW Blog
  • Strategies
        • SWING TRADING
          • Current Positions
          • Watchlists
          • Closed Positions
          • Candidates - TOP 100
          • Specialty Stocks
        • WEEKLY STOCK PICK
          • TPOW Charts
          • TPOW Performance
          • TPOW Strategy Guide
          • TPOW Performance Dashboard
        • DAY TRADING
          • Watch List
        • ATGL DASHBOARD
        • ETF STRATEGIES
          • ETF Sector Rotation
          • ETF Sector Portfolio
        • DIVIDEND GROWTH
          • Dividend Growth Portfolio
          • Dividend Calendar
        • DOGS OF THE DOW
          • Dogs of the Dow Portfolio
          • DOW 5 Portfolio
  • Markets
        • US MARKET
          • Commodities
          • Energy
          • Precious Metals
          • Volatility
        • GLOBAL MARKETS
          • Market Indices
          • Economic Calendar
          • FOREX Heat Map
          • FOREX Cross Rates
          • Crypto Currency Market
  • Investing
    • Discord Community
    • Dashboard
  • Resources
        • ARTICLES
          • Dividend Growth Model Articles
          • ETF Articles
          • Investment Strategies Articles
          • Market and Economic Insights
          • Stock Trade Articles
          • Stock Reviews
        • TOOLS
          • Stock Scanners
          • Charting Software
          • Brokerage Firms
        • STOCK CHARTS
          • Key Components
          • Reading Charts
          • Drawing Stock Charts
          • Identifying Trends
        • RETIREMENT PLANNING
  • About
    • Contact Us
    • How to Win
    • #1 At Stockcharts
    • Disclaimer
    • FAQ
  • Log In
  • Subscribe

IBEX 35 Index

IBEX 35 Index

What is the IBEX 35?

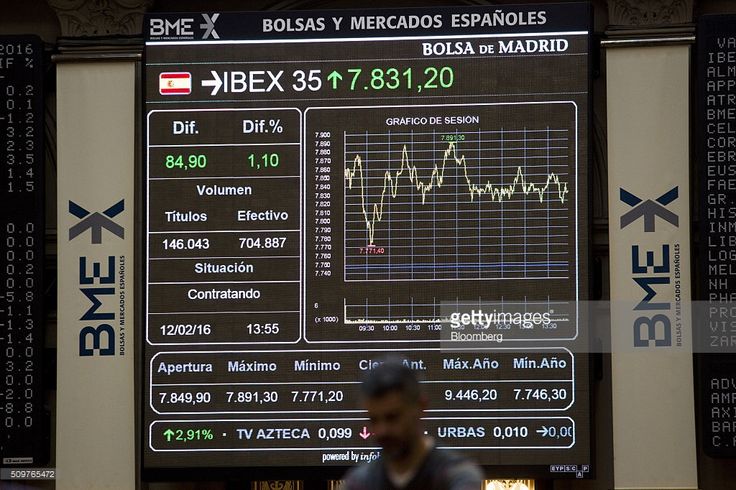
The IBEX 35 is the benchmark stock market index for Spain, comprising the 35 most liquid and capitalized companies listed on the Bolsa de Madrid, Spain’s principal stock exchange. Established in 1992, the index is a price-weighted index, meaning that companies with higher stock prices have a greater impact on the index’s overall performance. The IBEX 35 serves as a barometer for the Spanish economy and is a key indicator for investors looking to gauge market trends and performance in Spain.

Importance of the IBEX 35

  1. Economic Indicator: The IBEX 35 is a crucial indicator of the health of the Spanish economy. It reflects the performance of significant sectors such as banking, telecommunications, energy, and utilities, allowing investors to assess overall economic conditions.
  2. Market Representation: The index provides a snapshot of the Spanish stock market, encompassing some of the largest and most influential companies in the country, such as Banco Santander, Telefónica, and Repsol. This makes it a vital tool for understanding market dynamics and sector performance.
  3. Benchmark for Investment: The IBEX 35 is widely used as a benchmark by fund managers and institutional investors, allowing them to compare their portfolios’ performance against the broader market. This benchmark helps in evaluating investment strategies and tracking performance over time.

Why You Should Use the IBEX 35

  1. Diversification: Investing in the IBEX 35 allows investors to gain exposure to a diverse range of sectors within the Spanish economy. This diversification can help mitigate risks associated with individual stocks and sector-specific downturns.
  2. Investment Opportunities: The index includes well-established companies with strong market positions, providing potential investment opportunities for those looking to capitalize on Spain’s economic growth and recovery.
  3. Market Trends: The IBEX 35 can serve as a useful tool for identifying market trends and investor sentiment. Tracking the index can help investors make informed decisions based on market performance and economic indicators.

Should You Invest in the IBEX 35?

Investing in the IBEX 35 can be an attractive opportunity, but it is essential to consider both the potential benefits and the associated risks:

  1. Global Economic Factors: The performance of the IBEX 35 is influenced by both domestic and global economic factors. Economic conditions in the Eurozone, changes in interest rates, and global market trends can all impact the index. Investors should stay informed about these factors when considering investments.
  2. Volatility: Like any stock market index, the IBEX 35 is subject to market volatility. Economic downturns, political instability, or changes in investor sentiment can lead to price fluctuations. Investors should be prepared for potential ups and downs in their investments.
  3. Investment Vehicles: Investors can gain exposure to the IBEX 35 through various investment vehicles, including index funds and exchange-traded funds (ETFs) that track the index. These options typically offer lower fees compared to actively managed funds, making them an appealing choice for cost-conscious investors.
  4. Long-Term Strategy: Investing in the IBEX 35 is best suited for those with a long-term investment horizon. While short-term traders may find volatility challenging, long-term investors can benefit from potential economic recovery and growth in Spain.

In conclusion, the IBEX 35 serves as a vital index for understanding the Spanish stock market and the overall economy. Its diverse representation of major companies and sectors makes it an essential tool for investors seeking to gauge market trends and opportunities in Spain. While there are risks associated with investing in the index, the potential for growth and diversification it offers can make it a worthwhile consideration for investors. As with any investment, thorough research and a clear understanding of personal financial goals are crucial for success.


Related Articles

Dark Pools

What Are Dark Pools in the Stock Market? A Trader’s Guide

The modern stock market operates through multiple layers of complexity, where institutional investors execute massive orders that could significantly impact ...
Read More
Volume Profile Indicator

How to Use the Volume Profile Indicator for Price-Level Precision

Precision in market timing separates successful traders from those who struggle with inconsistent results. While price action provides valuable insights, ...
Read More
Gamma Squeeze

How a Gamma Squeeze Works and How to Spot One on a Chart

Unusual market events can trigger dramatic price movements that create significant opportunities for prepared investors. A gamma squeeze stands out ...
Read More
Quasimodo Pattern Explained

Why the Quasimodo Pattern Works (When You Know What to Look For)

Technical analysis remains central to the decision-making process for active traders and investors. Chart patterns provide structure when markets appear ...
Read More
Put Call Open Interest Ratio

What the Put/Call Open Interest Ratio Really Tells You About the Market

Understanding options market sentiment is a critical advantage for traders. The put-call open interest ratio (PCR OI) offers insight into ...
Read More
  • 1
  • 2
  • 3
  • …
  • 21
  • Next
Loading...

Subscribe to Our Newsletter

AGL Logo

Get our eBook Now!

Candlestick - A Swing Traders Friend

We don’t spam! Read our privacy policy for more info.

You’ve been successfully subscribed to our newsletter!

Voted #1 at Stock Charts

SH Chart
Inverse S&P 500 Fund (SH) will have a Money Wave Buy today.

Help Us Help Animals

Help Us Help Animals

Recent Comments

  • What Is a Calendar Spread and How to Trade It on IWM vs SPY: An ETF Comparison Analysis
  • Liquidity Risk in Stock Market: What It Is & Why It Matters on Swing Trading Risk Management: Tips To Safeguard Your Profits
  • Breakout Trading Strategies That Can Boost Your Gains on 7 Day Trading Strategies for New Investors
  • What the Descending Staircase Pattern Tells You About the Market on Bull vs. Bear Market: An Investor’s Guide to Market Phases
  • Want to Protect Your Capital? Start With Better Position Sizing on Risk Management in Trading: Tools and Techniques

Become a Green Liner!

Help me make more Money in the Stock Market.

ON ATGL

  • DashBoard
  • Weekly Commentary
  • Daily Buy / Sell Signals
  • Day Trade Setup
  • Trading Rooms

Design & Develop By Pixelvect

STRATEGIES

  • Swing Trading
  • ATGL Pick of the Week
  • Dividend Growth
  • ETF Sector Rotation
  • Dogs of the Dow

HELP

  • ATGL Trading Rules
  • FAQ
  • Account Maintenance
  • Contact US
  • Join

FOLLOW US

Instagram Linkedin Twitter Facebook

© COPYRIGHT 2024 · ABOVETHEGREENLINE.COM · ALL RIGHTS RESERVED · PRIVACY · TERMS · CONTACT · WATCHLIST · CURRENT