By ATGL
Updated March 17, 2024
Understanding the fair value of a stock is crucial for investors seeking to make informed decisions in the world of finance. While stock prices fluctuate daily based on market sentiment and various external factors, the fair value represents an estimate of a stock’s intrinsic worth. This value is derived from fundamental analysis, which delves into a company’s financial health, growth prospects, and industry dynamics.
In this article, we will explore the key principles and methods used to calculate the fair value of stocks. Whether you’re a seasoned investor looking to refine your valuation skills or a beginner eager to navigate the complexities of stock analysis, mastering the art of determining fair value can empower you to make confident and rational investment choices.
Why Is It Important To Have a Stock’s Fair Value Estimate?
Having a stock’s fair value estimate is crucial for investors as it serves as a reliable benchmark against which to assess its current market price. Understanding the fair value provides investors with insight into whether a stock is overvalued, undervalued, or fairly priced, helping them make informed investment decisions. By comparing the fair value estimate to the market price, investors can identify potential opportunities for buying low and selling high, maximizing returns while minimizing risks. Additionally, a fair value estimate acts as a fundamental anchor amidst market volatility and speculation, guiding investors with a rational and objective assessment of a stock’s intrinsic worth. Ultimately, having a stock’s fair value estimate empowers investors to navigate the complexities of the stock market with confidence and clarity, enabling them to build a robust and resilient investment portfolio over time.
What Is the Intrinsic Value of a Stock?
The intrinsic value of a stock represents its true worth based on fundamental factors such as a company’s earnings potential, growth prospects, asset value, and cash flow generation. Unlike market price, which can be influenced by investor sentiment and short-term fluctuations, intrinsic value focuses on the underlying economic fundamentals of a company. Essentially, it reflects the present value of all future cash flows that an investor expects to receive from owning the stock. Determining the intrinsic value requires a thorough analysis of financial statements, industry trends, competitive positioning, and macroeconomic factors. By understanding the intrinsic value of a stock, investors can make informed decisions about whether to buy, sell, or hold based on whether the stock is trading below, at, or above its intrinsic value.
What Are the Essential Metrics to Valuate Stocks?
Valuating stocks involves analyzing various metrics to gauge a company’s financial health, growth potential, and valuation relative to its peers and the broader market. Essential metrics for stock valuation include price-to-earnings ratio (P/E), which compares a company’s stock price to its earnings per share and indicates how much investors are willing to pay for each dollar of earnings; price-to-book ratio (P/B), which compares a company’s stock price to its book value per share and measures its market value relative to its net assets; and dividend yield, which represents the annual dividend payment as a percentage of the stock price and reflects the income generated for shareholders. Additionally, metrics such as earnings growth rate, return on equity (ROE), debt-to-equity ratio, and free cash flow are crucial for assessing a company’s profitability, efficiency, leverage, and ability to generate cash. By analyzing these essential metrics comprehensively, investors can gain valuable insights into a company’s valuation and make informed investment decisions.
3 Stock Valuation Methods To Calculate Fair Value
There are several stock valuation methods employed by investors and analysts to calculate a stock’s fair value, each offering unique insights into a company’s worth. One widely used method is the discounted cash flow (DCF) analysis, which estimates the present value of a company’s future cash flows. By discounting projected cash flows back to their present value using a discount rate that reflects the risk associated with the investment, DCF analysis provides a holistic view of a company’s intrinsic value. Another common method is the comparative valuation approach, which involves comparing key financial metrics such as price-to-earnings (P/E) ratio, price-to-book (P/B) ratio, and enterprise value-to-EBITDA (EV/EBITDA) ratio to those of similar companies in the same industry. This method allows investors to assess a company’s valuation relative to its peers and identify potential discrepancies. Finally, the dividend discount model (DDM) is used specifically for dividend-paying stocks, estimating the present value of future dividend payments. By applying these three stock valuation methods—DCF analysis, comparative valuation, and DDM—investors can gain a comprehensive understanding of a stock’s fair value and make informed investment decisions.
1. Analyzing and Comparing Companies Based on Various Ratios
Analyzing and comparing companies based on various ratios is a fundamental aspect of investment research and decision-making. Ratios provide valuable insights into a company’s financial health, performance, and valuation, allowing investors to assess its strengths, weaknesses, and relative attractiveness compared to peers. Key ratios commonly used for analysis include profitability ratios such as return on equity (ROE) and profit margins, which measure a company’s ability to generate profits from its shareholders’ equity and sales, respectively. Additionally, liquidity ratios like the current ratio and quick ratio help assess a company’s short-term liquidity and ability to meet its short-term obligations. Debt ratios such as the debt-to-equity ratio and interest coverage ratio provide insight into a company’s leverage and financial risk. Finally, valuation ratios like the price-to-earnings (P/E) ratio and price-to-book (P/B) ratio help investors gauge a company’s valuation relative to its earnings and book value. By analyzing and comparing these ratios across multiple companies within the same industry or sector, investors can identify trends, evaluate performance, and make informed investment decisions.
2. Leveraging the Dividend Discount Model (DDM)
Leveraging the Dividend Discount Model (DDM) is a powerful technique employed by investors to estimate the intrinsic value of dividend-paying stocks. At its core, the DDM calculates the present value of all future dividend payments that an investor expects to receive from owning a particular stock. This model assumes that dividends are a key driver of shareholder value and that the value of a stock is determined by the sum of its expected future dividend payments, discounted back to their present value using an appropriate discount rate. The DDM is particularly useful for income-oriented investors who prioritize dividend income and seek to identify stocks that offer attractive dividend yields relative to their intrinsic value. By applying the DDM, investors can assess whether a stock is undervalued, overvalued, or fairly priced based on its expected dividend payments, helping them make informed decisions about their investment portfolios.
3. Using the Discounted Cash Flow (DCF) Model
Using the Discounted Cash Flow (DCF) model is a sophisticated yet essential approach for estimating the intrinsic value of a company’s stock. At its core, the DCF model forecasts a company’s future cash flows and discounts them back to their present value using a predetermined discount rate, typically the company’s cost of capital. By considering the time value of money, the DCF model accounts for the fact that a dollar received in the future is worth less than a dollar received today. This method provides investors with a comprehensive and forward-looking assessment of a company’s value, incorporating factors such as revenue growth, profitability, capital expenditures, and risk. The DCF model is widely used by analysts and investors for its ability to capture the underlying fundamentals of a business and its potential to generate long-term shareholder value. By employing the DCF model, investors can make informed decisions about buying, selling, or holding a stock based on its estimated intrinsic value relative to its current market price.
Are Stock Market Value and Fair Value the Same?
While related, stock market value and fair value are not necessarily the same. Stock market value, often referred to as market capitalization, represents the total market value of a company’s outstanding shares and is determined by multiplying the current market price per share by the total number of shares outstanding. This value is driven by supply and demand dynamics in the stock market and can fluctuate daily based on investor sentiment, market trends, and other external factors. On the other hand, fair value is an estimate of a stock’s intrinsic worth based on fundamental analysis, taking into account factors such as a company’s financial performance, growth prospects, and industry dynamics. Fair value aims to reflect the true economic value of a company’s shares and may differ from its market value if the stock is perceived to be overvalued or undervalued by investors. While stock market value provides a snapshot of a company’s current valuation in the market, fair value offers a more objective assessment of its underlying fundamentals and long-term investment potential.
Improve Your Stock Profit Margins With Above the Green Line
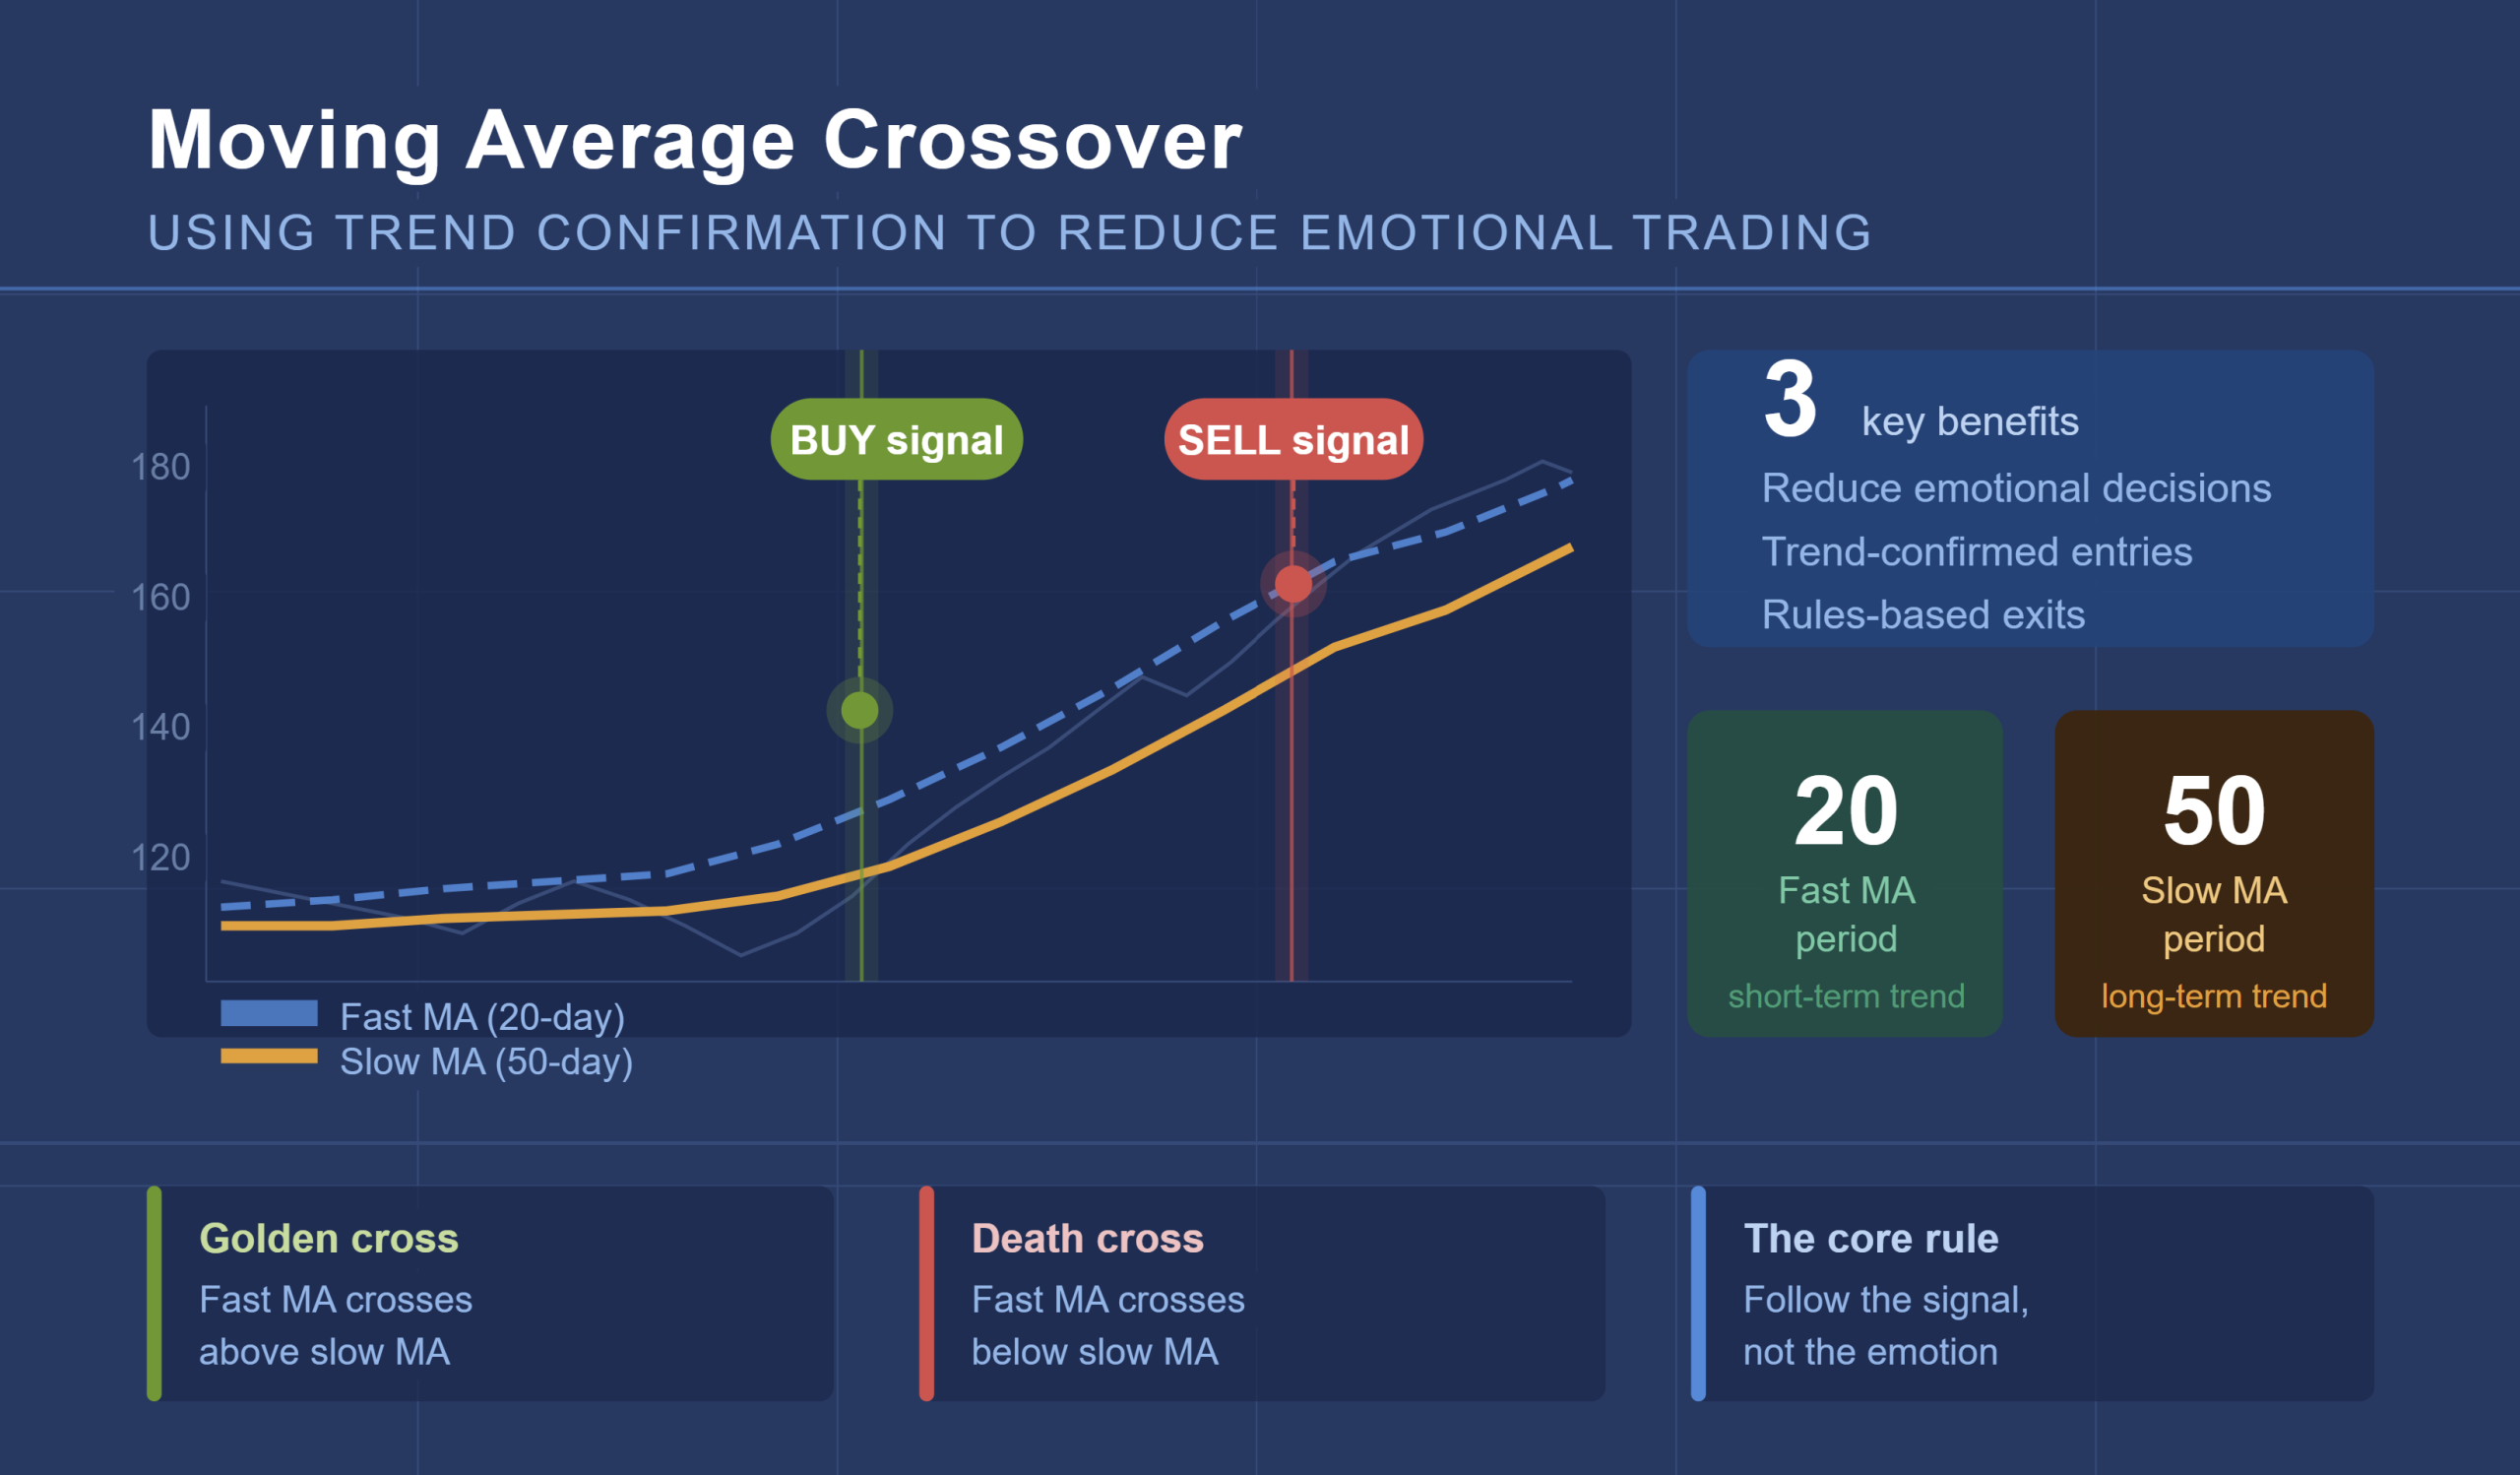
Improving your stock profit margins with Above the Green Line strategy involves a disciplined approach to stock trading focused on maximizing profits while minimizing risk. The concept originates from technical analysis, where the “green line” represents the 50-day moving average of a stock’s price. The strategy entails buying stocks that are trading above this green line, indicating bullish momentum, and selling when they fall below it, signaling potential weakness. By adhering to this strategy, investors aim to capture gains during uptrends while avoiding losses during downtrends. Additionally, the Above the Green Line approach emphasizes the importance of risk management, including setting stop-loss orders to protect profits and limit losses. By implementing this strategy, investors can enhance their stock profit margins by aligning their trades with the prevailing market trend and exercising discipline in their trading decisions.
To take the first step towards improving your stock profit margins, explore our membership options at Above the Green Line.

Related Articles
[pt_view id=”9517038dwu”]