
What is the Green Zone in Trading?
Introduction to the Green Zone
In the world of trading, the Green Zone refers to a specific price range or area on a stock chart where a stock exhibits strong upward momentum. This term is used to identify stocks that are breaking through resistance levels and showing signs of significant price appreciation. By focusing on stocks within the Green Zone, traders can target stocks poised for big moves, increasing the potential for profits.
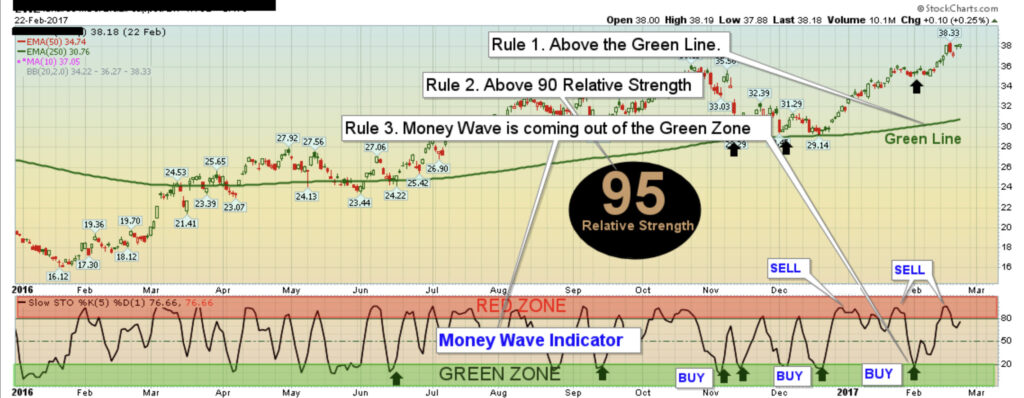
The Green Zone is often identified through a combination of technical indicators, but one of the most reliable methods is the use of the stochastic oscillator. The stochastic indicator compares a stock’s closing price to its price range over a specific period. When the stochastic is in the Green Zone, it means the stock is in an overbought territory and is showing signs of upward momentum. Typically, this is identified when the stochastic reading exceeds a certain threshold, such as the 80% line, which is considered a sign that the stock is trending strongly upward.
By focusing on stocks in the Green Zone, traders can identify assets with the highest potential for significant price moves. These are stocks that have momentum, breaking through prior resistance levels, which could suggest the start of a new bullish trend. As a trader, recognizing these opportunities early allows you to position yourself for maximum gains, ideally before the stock reaches its peak.
How Does the Green Zone Work?
The Green Zone is identified using a combination of technical indicators and chart patterns that suggest a stock is about to break out. Key characteristics include:
- Support and Resistance Levels: When a stock price is consistently bouncing between a defined range, breaking out of that range signals that the stock may be primed for a significant move.
- Volume Analysis: A surge in volume accompanying the price action is a strong confirmation that the breakout is valid and not a false signal.
- Momentum Indicators: Tools like the Relative Strength Index (RSI) or Stochastic Oscillators can help identify when a stock is “overbought” or showing signs of increasing momentum.
The goal of trading within the Green Zone is to take advantage of stocks that are breaking above key resistance levels, usually signaling a strong move upwards. This approach helps mitigate risk by focusing on stocks with a high probability of success.
The Importance of the Green Zone in Trading
Maximizing Profit Potential
The Green Zone allows traders to enter a stock before it makes a major move. By identifying stocks that are poised to break out, traders can position themselves early and benefit from significant price gains. Stocks within the Green Zone often experience explosive growth due to:
- Breaking Key Resistance: Once a stock breaks through resistance levels, it often continues to rise, as the previous selling pressure is overcome. This can result in sharp price appreciation.
- Increased Demand: When a stock breaks the Green Zone, it attracts attention from institutional investors, which often leads to increased buying pressure.
- Momentum: Stocks that break out of the Green Zone often have strong momentum, which makes them more likely to continue their upward trajectory.
Lowering Risk
Another key advantage of the Green Zone strategy is its potential to lower risk. By entering positions at key breakout points, traders avoid the uncertainty that often comes with buying stocks at unpredictable price levels. The Green Zone provides a clear signal of price strength, giving traders more confidence in their trade decisions.
In addition, using the Green Zone as part of a risk management strategy allows traders to set stop-loss orders at logical price points (i.e., below the breakout level). This minimizes potential losses if the trade does not go as planned.
How to Determine the Green Zone Using Stochastic Indicators
To effectively use the Green Zone strategy, you need to understand how the stochastic indicator works. The stochastic oscillator is a momentum indicator that measures the current closing price relative to its price range over a given period (usually 14 periods). This provides insight into the strength of the current trend and whether a stock is overbought or oversold.
Here’s how you can determine the Green Zone using the stochastic indicator:
- Look for Overbought Levels: The stochastic oscillator typically ranges from 0 to 100, with values above 80 often indicating overbought conditions. When the stochastic crosses above the 80% level, it is signaling that the stock may be in a Green Zone, showing strong upward momentum. A stock in this zone is often in the midst of a bullish breakout.
- Confirm with Price Action: While the stochastic indicator is a powerful tool, it should be confirmed by price action. Look for the stock to break through key resistance levels on the chart while the stochastic is in the overbought zone. This combination suggests that the stock is not just moving upwards but is likely to continue moving higher.
- Crossing Above the Stochastic’s Signal Line: The stochastic indicator includes two lines – %K (the fast line) and %D (the slow line). A cross of %K above %D while both lines are above the 80% level can be a strong confirmation that the stock is in the Green Zone. This signals that the momentum is likely to continue, making it a good time to enter the trade.
- Watch for Continuation Patterns: When a stock is in the Green Zone, look for continuation patterns like ascending triangles, bull flags, or other chart patterns that suggest the stock will continue to move upward. These patterns, when combined with a stochastic reading in the Green Zone, increase the probability of a successful trade.
By applying these principles, traders can effectively use the Green Zone strategy to identify stocks that are ready for significant moves, maximizing potential profits and minimizing the risk of getting in too late in a trend.
How to Trade using Green Zone
Step 1: Analyze the Stock Chart
The first step in identifying the Green Zone is to carefully analyze a stock’s chart. Look for clear levels of support (the price level at which the stock tends to bounce back up) and resistance (the price level at which the stock tends to face selling pressure). A stock that is approaching a resistance level and shows signs of upward momentum may be entering the Green Zone.
Step 2: Use Key Technical Indicators
In addition to support and resistance, use technical indicators to identify potential breakouts. The Relative Strength Index (RSI), for example, can indicate whether a stock is overbought or oversold, helping traders identify when a stock is likely to make a move. Additionally, Moving Averages (such as the 50-day or 200-day) are excellent tools for confirming trends and determining potential breakout points.
Step 3: Confirm with Volume
Once you’ve spotted a potential Green Zone breakout, check the volume. A surge in volume is often a sign of institutional buying, which indicates that the breakout has strength behind it. High volume supports the idea that the stock is more likely to continue moving upward and not simply retest the resistance level.
Step 4: Set Your Entry and Exit Points
Once you’ve confirmed that a stock is in the Green Zone, you can set your entry point (when to buy) and exit point (when to sell). A strong entry point is typically just after the breakout, as the stock begins to rise above resistance levels. The exit point is typically based on either a target price (a predefined price goal) or a trailing stop to protect profits as the stock continues to move upwards.
TPOW Strategy and the Green Zone
Introducing TPOW: Top Pick of the Week
At Above the Green Line, we use a strategy called TPOW (Top Pick of the Week) to select stocks that are breaking into the Green Zone. Each week, our team identifies stocks that meet our strict criteria of technical strength, high volume, and strong potential for price movement. By applying the Green Zone strategy to TPOW, we focus on stocks that are poised to make strong moves within a short period—typically over the course of one trading week.
How TPOW Utilizes the Green Zone Strategy
The TPOW strategy uses the Green Zone to identify stocks that have strong technical indicators and are likely to make substantial gains within a short period. Stocks selected for TPOW:
- Have a high SCTR (StockCharts Technical Ranking) score—indicating technical strength.
- Are breaking key resistance levels—setting them up for potential price moves.
- Have strong volume—confirming that the breakout is supported by real buying interest.
By identifying these key stocks at the right time, TPOW members can take advantage of upward price moves and achieve average gains of 3-4% per week when compounded, leading to strong returns over time.
Why the Green Zone is Essential for Your Trading Success
Consistent Profits with Minimal Risk
The Green Zone offers a clear entry point for traders. By focusing on stocks that are in the Green Zone, traders increase their chances of success while reducing the risks associated with trading. The strategy identifies stocks that are likely to continue moving upwards, which leads to more consistent profits.
Compounding Gains
When used consistently, the Green Zone strategy helps traders to capture gains week after week, which can compound over time. For example, even a 3% weekly gain, when compounded, can lead to significant long-term growth. By using the Green Zone to select strong, high-probability trades, traders can grow their portfolios steadily and consistently.
Trade with Confidence
The Green Zone strategy is all about identifying stocks with strong technicals and upward momentum. By leveraging this strategy, traders can enter positions with confidence, knowing they are backing their trades with solid analysis and a high probability of success.
Join the Green Zone Revolution Today
Start Trading Smarter with Above the Green Line
Whether you’re a beginner or an experienced trader, the Green Zone strategy is a powerful tool that can help you identify high-potential stocks ready to make significant moves. At Above the Green Line, we offer expert guidance, advanced tools, and a supportive community to help you maximize your trading profits.
Get Started
Ready to harness the power of the Green Zone and start making smarter, more profitable trades? Join Above the Green Line today and gain access to our exclusive TPOW strategy, daily insights, technical analysis tools, and more!
