Above the Green Line -01
  • Market Insights
        • Commentary
          • Daily
          • Weekly
        • BUY / SELL SIGNALS
          • Trade Posts
          • Recent Trade Alerts
          • Recent Day Trades
        • BLOGROLL
          • Dividend Growth Blog
          • ETF Sector Blog
          • Dow Dogs
          • TPOW Blog
  • Strategies
        • SWING TRADING
          • Current Positions
          • Watchlists
          • Closed Positions
          • Candidates - TOP 100
          • Specialty Stocks
        • WEEKLY STOCK PICK
          • TPOW Charts
          • TPOW Performance
          • TPOW Strategy Guide
          • TPOW Performance Dashboard
        • DAY TRADING
          • Watch List
        • ATGL DASHBOARD
        • ETF STRATEGIES
          • ETF Sector Rotation
          • ETF Sector Portfolio
        • DIVIDEND GROWTH
          • Dividend Growth Portfolio
          • Dividend Calendar
        • DOGS OF THE DOW
          • Dogs of the Dow Portfolio
          • DOW 5 Portfolio
  • Markets
        • US MARKET
          • Commodities
          • Energy
          • Precious Metals
          • Volatility
        • GLOBAL MARKETS
          • Market Indices
          • Economic Calendar
          • FOREX Heat Map
          • FOREX Cross Rates
          • Crypto Currency Market
  • Investing
    • Discord Community
    • Dashboard
  • Resources
        • ARTICLES
          • Dividend Growth Model Articles
          • ETF Articles
          • Investment Strategies Articles
          • Market and Economic Insights
          • Stock Trade Articles
          • Stock Reviews
        • TOOLS
          • Stock Scanners
          • Charting Software
          • Brokerage Firms
        • STOCK CHARTS
          • Key Components
          • Reading Charts
          • Drawing Stock Charts
          • Identifying Trends
        • RETIREMENT PLANNING
  • About
    • Contact Us
    • How to Win
    • #1 At Stockcharts
    • Disclaimer
    • FAQ
  • Log In
  • Subscribe

September 29, 2019

Green Line Weekly Sept 29, 2019

SPX Chart
S&P 500 Index should do a Double Top (Bearish) or Cup & Handle (Bullish) pattern soon.


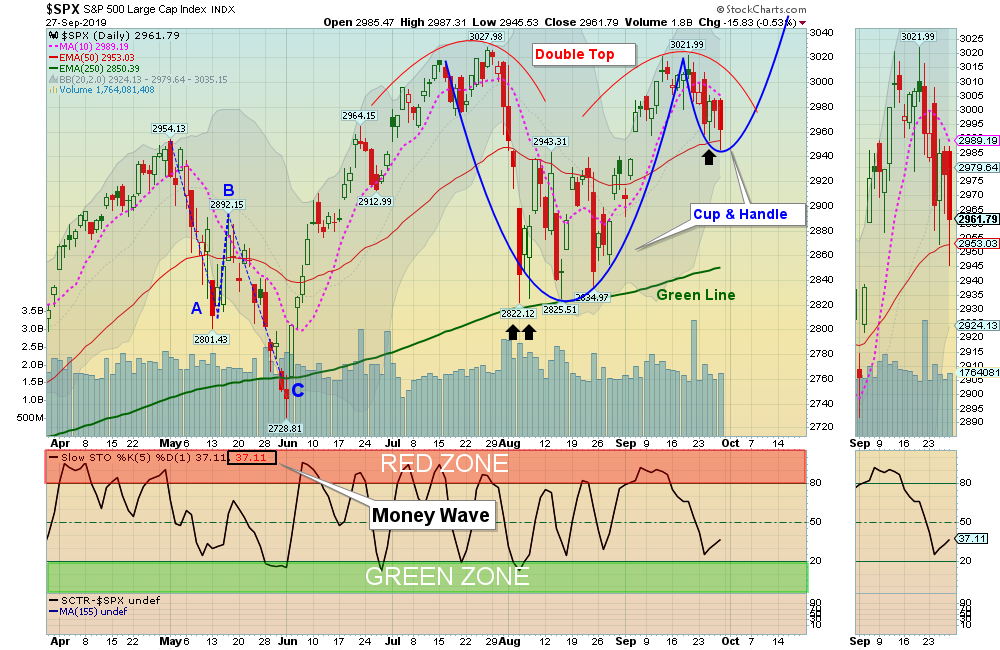
09/29/2019:  Markets were down again for the week, as the Bears are betting on a Double Top on the S&P 500 Index. The Bulls are betting on a “Cup & Handle” pattern. A Cup & Handle pattern would normally stall at Resistance, fade back down towards the Red Line (50-day avg.) and then surge back up to New Highs. We will find out soon. 

The Gold and Gold Miners are back down in the Green Zones for another bounce attempt soon. We did not capture the small Gains on the Precious Metals last week, and most got Stopped Out.

For the week the Dow was down 0.47%, the S&P 500 was down 0.97%, and the Nasdaq 100 was down 1.78%.  The Long Term Trend on the Stock Markets is UP. 

The Inflation Index (CRB) was down 0.91% and is Below the Green Line, indicating Economic Weakness.

Bonds  were up 0.59% for the week and are Above the Green Line, indicating Economic Weakness.

The US DOLLAR was up 0.67%, a 3 year High. 

Crude Oil was down 3.75% for the week at $55.91, and GOLD was down 0.57%  at $1506.40.

___________________________________________________________________________________________

MONEY WAVE BUYS SOON:   

We are currently in 5 logged Open Positions, for the Short & Medium Term.  There are 6 Investments on the Short Term Watch List. 

Be patient and WAIT for Green Zone Buy Signals!

______________________________________________________________________________________________

LONG TERM INVESTMENTS 

Buy the Leading Investments that are down near the weekly Green Zones.     

ARWR     ARROWHEAD PHARMA.      Wait for Weekly Money Wave Close > 20.

CDNS     CADENCE DESIGN    Wait for Weekly Money Wave Close > 20.

OKTA     OKTA INC.      Wait for next Daily Green Zone Buy.

SBGI     SINCLAIR BROADCAST GROUP    Buy if it is going to Close above $45.73.   

SBUX     STARBUCKS    Buy if it is going to Close above $92.10.   

TTD     TRADE DESK INC.      Wait for Weekly Money Wave Close > 20.


___________________________________________________________________________________________

Click for  Portfolio (Open Positions)  
Click for  Watch List
Click for  Closed Positions


Alert! Market Risk is MEDIUM (Yell0w Zone). The probability of successful Short Term Trades is better, when the % of stocks above the 50-day avg. is below 20. 

Tell your Friends about the Green Line, and Help Animals

___________________________________________________________________________________________

QUESTION:  Janet writes: “I just signed up to your system.  I trade intraday so I need to know the following: 1) Indicators and their individual settings (Money Wave/Slow Stochastic), What time frame will I use on my charts for using this system intraday i.e., 5 minutes, 30 minutes?, 3) Do I still use the 250 EMA for trading intraday?”

ANSWER:  Hi Janet, and thank you for subscribing. We suggest you review the FAQ Page and the Rules.

We use 60-min and Daily Charts for most trades, and Weekly Charts for Longer Term trades.

Please read about JUMP START to get into the Daily Buy Signal trades before the end of the day.

The Money Wave Indicator is a simple term for Slow Stochastic 5,1… All indicator values are labeled on each Chart.

Good trading, and tell your friends!

Related Post

– Green Line Weekly Sep 29, 2019

Subscribe to Our Newsletter

AGL Logo

Get our eBook Now!

Candlestick - A Swing Traders Friend

We don’t spam! Read our privacy policy for more info.

You’ve been successfully subscribed to our newsletter!

Voted #1 at Stock Charts

SH Chart
Inverse S&P 500 Fund (SH) will have a Money Wave Buy today.

Help Us Help Animals

Help Us Help Animals

Recent Comments

  • Market Breadth Indicators: A Trader’s Guide to Early Trend Detection on Backtesting: Definition and How a Trading Strategy Backtest Works
  • Island Reversal Pattern: Definition and Formation Explained on Double Top Pattern: How to Identify and Trade This Reversal Signal
  • Channel Pattern Guide: What It Is and Why It Matters on A Guide to Forecasting Using Moving Averages
  • What Is a Broadening Bottom Chart Pattern? Full Guide on Bull vs. Bear Market: An Investor’s Guide to Market Phases
  • ATGL Weekly Money Flow - 2025-05-11 on ATGL Top Pick of the Week! Apr 6, 2025

Become a Green Liner!

Help me make more Money in the Stock Market.

ON ATGL

  • DashBoard
  • Weekly Commentary
  • Daily Buy / Sell Signals
  • Day Trade Setup
  • Trading Rooms

Design & Develop By Pixelvect

STRATEGIES

  • Swing Trading
  • ATGL Pick of the Week
  • Dividend Growth
  • ETF Sector Rotation
  • Dogs of the Dow

HELP

  • ATGL Trading Rules
  • FAQ
  • Account Maintenance
  • Contact US
  • Join

FOLLOW US

Instagram Linkedin Twitter Facebook

© COPYRIGHT 2024 · ABOVETHEGREENLINE.COM · ALL RIGHTS RESERVED · PRIVACY · TERMS · CONTACT · WATCHLIST · CURRENT