
09/06/2020 Markets started the week making New Highs as Tammy just had to Buy Apple & Tesla on the Good News after they split on Monday (possibly at the Top). Then Smart Money took profits and the NASDAQ 100 quickly dumped 10% before a nice recovery on Friday.
The Strongest Leaders were up in the Red Zones (probably too late to Buy for the Short Term) and are finally coming down some for Money Wave Buys soon. Some of the Leading Indices dipped down to their Red Lines (50-day avgs.) for the first time in months, as they were stretched Way Above the Green Lines. Then Smart Money eventually takes profit on the Good News.
It looks like the emotional Investors have spent most of their Cash by buying Way Above the Green Lines, and the Markets should pull back. But first the Strongest Investments could quickly pop back up to re-test the recent Highs. Then if they can’t make Higher Highs, they should return back down into the Green Zones for Money Wave Buy Signals. These are NASDAQ 100 (QQQ), Semiconductor Fund (SMH), Home Building Fund (XHB), Internet Fund (FDN) Solar Fund (TAN) & Retail Fund (XRT), but they are currently over bought.
PENNY STOCK WATCH LIST has many Green Zones Buy Signals soon that are 50-80% off the recent Highs.
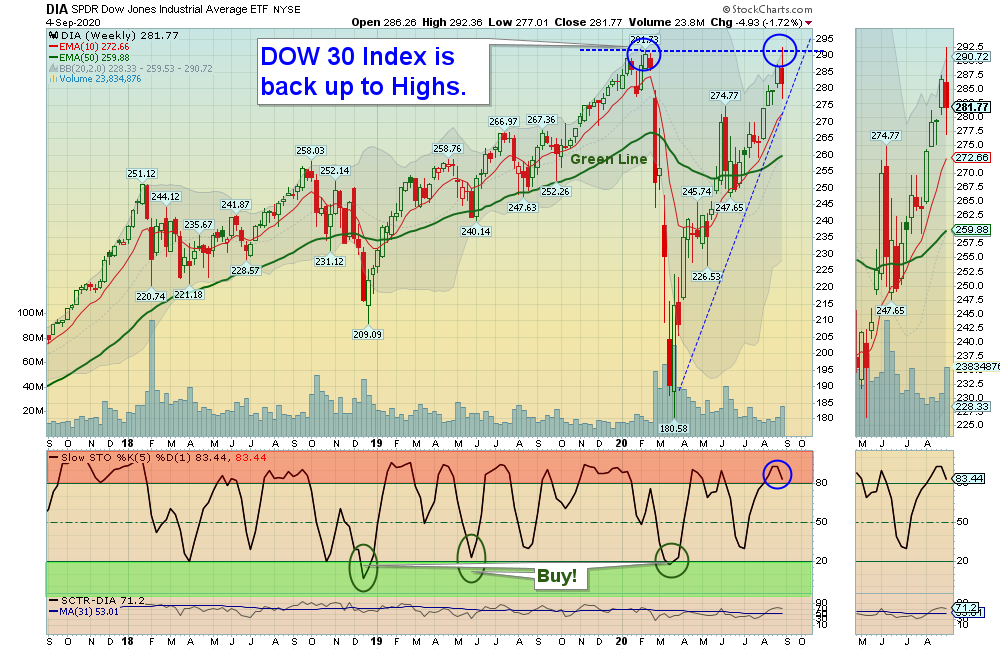
For the week the Dow was down 1.72%, the S&P 500 was down 2.31%, and the Nasdaq 100 was down 3.06%. The Long Term Trend for the Indices is up.
The Inflation Index (CRB) was down 2.44% and is below the Green Line, indicating Economic Weakness.
Bonds were up 1.12% for the week and are Above the Green Line, indicating Economic Weakness.
The US DOLLAR was up 0.64% for the week and is over-sold Below the Green Line.
Crude Oil was down 7.45% for the week at $39.77 and GOLD was down 2.06% at $1934.30.
_____________________________________________________________________________________________
MONEY WAVE BUYS SOON
We are currently in 4 logged Current Positions, for the Short & Medium Term. There are 10 Investments on the Short Term Watch List.
Be patient and WAIT for Green Zone Buy Signals!
______________________________________________________________________________________________
LONG TERM INVESTMENTS (Most of the Leaders are back up in the Weekly Red Zones.)
Buy the Leading Investments that are down near the Weekly Green Zones.
AUY YAMANA GOLD Wait for Money Wave Buy Signal soon. All time High is $18.50.
FCEL FUELCELL ENERGY INC. Buy if it Closes above $3.42 on High Volume. All time High is $682.00.
INO INOVIO PHARMA. Wait for a Close above the Pink Line. All time High is $33.79.
LLY ELI LILLY & CO. Buy if it Closes above $154.41 on High Volume.
NK NANTKWEST INC. Wait for a Close above the Pink Line. All time High is $35.00.
RIOT RIOT BLOCKCHAIN INC. Wait for the next Daily Money Wave Buy. All time High is $46.20.
______________________________________________________________________________________
Click for Current Positions
Click for Watch List
Click for Closed Positions
Dividend Growth Portfolio (we are now posting a Dividend Calendar for the entire portfolio to assist with planning purposes).
ETF Sector Rotation System – Next Quarterly Rotation will be on was on Sep 30 & Oct 1, 2020.
Long Term Strategy for IRAs & 401k Plans
Alert! Market Risk is HIGH (Red Zone). The probability of successful Short Term Trades is better, when the % of stocks above the 50-day avg. is below 20.
Tell your Friends about the Green Line, and Help Animals
___________________________________________________________________________________________
QUESTION: Jerry S. writes “How do I know when to Sell?”
ANSWER: Hi Jerry. Please follow the Rules for Selling below based on the Time Frame that you want to be in the Investment:
- Short Term: Sell when it Closes below the Pink Line (10-day avg.)
- Medium Term: Sell when it Closes below the Red Line (50-day avg.)
- Long Term: Sell when it Closes below the Green Line (250-day avg).
Or Follow the PORTFOLIO (please click) on your daily emails.
Good trading, and tell your friends!
