
The Top Pick of the Week System is up +88 %, vs the S&P 500 up +20.4% (since the Oct. 7, 2024 inception).
For busy investors that don’t have time to Swing Trade, we now have a simple Strategy:
Top Pick of the Week. You Buy the “Pick” on Monday morning, and then Sell on Friday’s Close. It’s a time-efficient approach designed to capture short-term gains without requiring constant market monitoring.
This “Pick” is emailed to you with this Weekly Commentary (see below & more details here).
The Top Pick of the Week is: Lumen Tech Inc. $LUMN to Buy on the Open on Monday, and Sell on the Close Friday.
You can view the current Weekly Stock Performance.
______________________________________________________________________________
DAILY SWING TRADING (SHORT TERM)Watch List and Charts to Buy Soon.
| Daily Swing Watch List to Buy | Daily Swing Charts to Buy |
| Current Daily Swing Positions | Current Swing Charts |
| Closed Daily Swing Results | Trading Dashboard |
11/16/2025 Markets were mixed for the week as high momentum Leaders had some large profit taking. Many of these Leaders were extremely over-bought, and have Flushed out many Greedy Retail investors who bought at the Top and got Margin Calls. We are currently underwater on some of these, so please be patient and wait for a probable bounce back up.
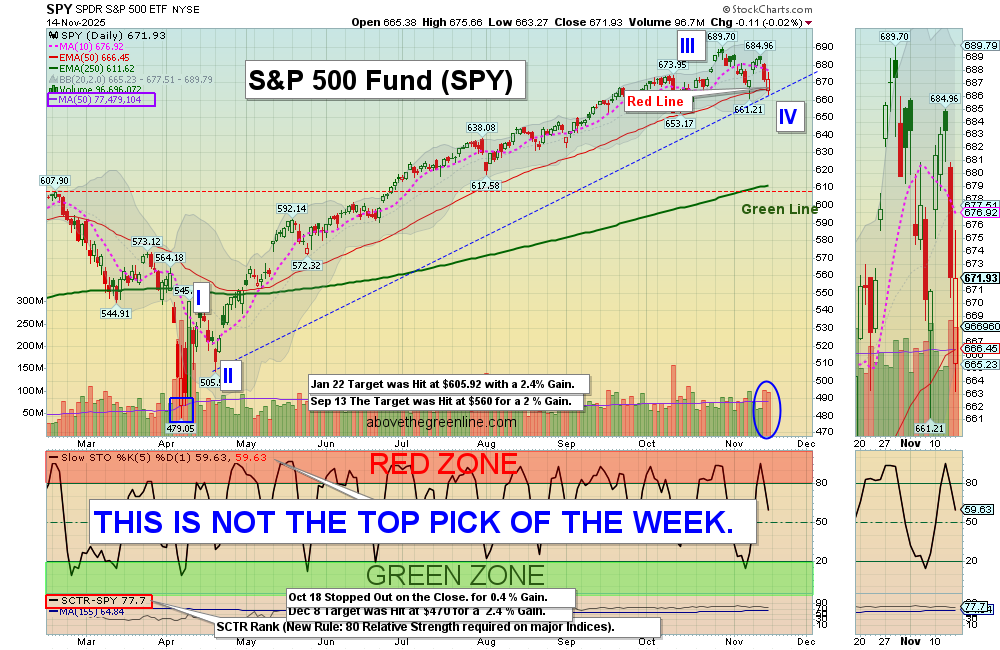
The SPY, DOW 30, and QQQ Indices dropped back down to the Red Lines (50-day avgs.) and should bounce back up again soon. If the Indices cannot make higher Highs on the next bounce up, then we could see a larger Double Top that could bring in more Selling.
We know from history that the Markets will meet again with their Green Lines, so if you will be needing to live off your Retirement Plan soon, fight your Greed, and Raise some Cash. Wait for some BAD NEWS like in April, and we will Buy back into the major Indices.
We Buy the strongest Leaders that make new highs, on pull-backs. So follow the Green Line System and you should continue to win more than you lose. SEE WATCH LIST
With the Green Line System, your Money should flow into the Strongest areas and your Account value should be able to grow in both Bull and Bear Markets. Follow the MONEY, not the MEDIA.
______________________________________________________________________________
For the week the Dow was up 0.41%, the S&P 500 was up 0.08% and the NASDAQ 100 was down 0.14%. The major Indices still have a Relative Strength below 80, so you should currently own the stronger Funds here.
The Inflation Index (CRB) was up 0.48% this week and is Above the Green Line, indicating Economic Expansion.
Bonds were down 0.78% for the week, and are Above the Green Line, indicating Economic Contraction.
The US DOLLAR was down 0.33% for the week.
Crude Oil was down 1.69% for the week at $59.95 and GOLD was up 1.98% at $4080.00.
_______________________________________________________________________
DAY TRADERS: We are doing many profitable Day Trades at our Live Trading Room on YouTube during Market hours. Please join Discord or X (Twitter) with your cell phone app for the fastest Trade Alerts and Daily email notifications during the day. Other methods of notification have been too slow.
_______________________________________________________________________
COMPLETED DAILY SWING TRADE TRADES:
GLD Gold Fund Target was Hit at $79 with an 8.5 %% Gain.
SLV Silver Fund Target was Hit 47.09 with a 10.3% Gain.
MP & ONDS Slipped down to the Buy Price, and were stopped out even.
We are now in 1 Three Star logged Swing Trading Position for the Short Term. There are 5 investments on the Short Term Watch List.
Completed Swing Trades thru Oct 2025: 219 Trades, + 640.24% Total. Avg. Trade = 2.92 % Gain (before taxes and commissions).
______________________________________________________________________________
WEEKLY SWING TRADES – WATCH LIST
| Open Date | Symbol | Description | Industry | SCTR | Size | Last Price | Daily Change % | ATGL 60 Min | Comments | id | Strategy | Position | Sell Date | Sell Price | Purchase Price | Net Profit | Realized Gain/Loss % | ATGL Rule | Stop Loss | color | Chart | Update Date | Status | Unrealized Gain/Loss % | Volume | Post Type | # Shares | Amount Invested | Portfolio Weight | Dividend Rate | Current Yield | Current Value | Yield on Cost | Projected Annual Dividends | Total Dividends Received | Pay Back | Profit / Loss | Annualized Profit/Loss | Star Rating | Target Price | News Alert % | Target Triggered |
|---|---|---|---|---|---|---|---|---|---|---|---|---|---|---|---|---|---|---|---|---|---|---|---|---|---|---|---|---|---|---|---|---|---|---|---|---|---|---|---|---|---|---|
| 2026-07-08 | BW | Babcock & Wilcox | Financial | 96 | Small | $10.93 | -6.5812 | Wait for next Weekly Money Wave Close > 20 with High Volume. | 5123 | Long Term | Long | $0.00 | 0.00% | https://stockcharts.com/sc3/ui/?s=BW&a=2308001998&p=W&yr=1&mn=0&dy=0&id=p84859429849 | 2026-07-08 18:53:47 | open | 0.00% | 3578545 | Watch List | $0 | 0.00% | 0.00 | 0 | $0 | 0.00% | $0 | $0 | 0.00% | 0.00% | - | $17.00 | |||||||||||
| 2026-07-01 | NVTS | Navaitas Semi. | Semiconductor | 80 | Mid | $12.87 | -4.4543 | Wait for next Weekly Money Wave Close > 20 with High Volume. | 5114 | Long Term | Long | $0.00 | 0.00% | https://stockcharts.com/sc3/ui/?s=NVTS&a=2304700575&p=W&yr=1&mn=0&dy=0&id=p49574092537 | 2026-07-02 22:12:37 | open | 0.00% | 12117116 | Watch List | $0 | 0.00% | 0.00 | 0 | $0 | 0.00% | $0 | $0 | 0.00% | 0.00% | - | $24.00 | |||||||||||
| 2026-06-30 | NOK | Nokia Corp. | Telecom | 92 | Large | $11.69 | -6.0289 | Wait for next Weekly Money Wave Close > 20 with High Volume. | 5108 | Long Term | Long | $0.00 | 0.00% | https://stockcharts.com/sc3/ui/?s=NOK&a=2302004445&p=W&yr=1&mn=0&dy=0&id=p52583455345 | 2026-06-30 16:54:43 | open | 0.00% | 103877820 | Watch List | $0 | 0.00% | 0.16 | 1.3798 | $0 | 0.00% | $0 | $0 | 0.00% | 0.00% | - | $16.00 | |||||||||||
| 2026-06-29 | AAOI | Applied Opto | Telecom | 95 | Small | $111.88 | -6.7045 | Wait for next Weekly Money Wave Close > 20 with High Volume. | 5104 | Long Term | Long | $0.00 | 0.00% | https://stockcharts.com/sc3/ui/?s=AAOI&a=2300865339&p=W&yr=1&mn=6&dy=0&id=p68280620441 | 2026-07-05 19:24:45 | open | 0.00% | 6599643 | Watch List | $0 | 0.00% | 0.00 | 0 | $0 | 0.00% | $0 | $0 | 0.00% | 0.00% | - | $180.00 | |||||||||||
| 2026-06-26 | AA | Alcoa Corp. | Metals | 89 | Mid | $48.72 | 0.0822 | Wait for next Weekly Money Wave Close > 20 with High Volume. | 5101 | Long Term | Long | $0.00 | 0.00% | https://stockcharts.com/sc3/ui/?s=AA&a=2299172341&p=W&yr=1&mn=6&dy=0&id=p00174284214 | 2026-06-26 17:47:58 | open | 0.00% | 4041646 | Watch List | $0 | 0.00% | 0.40 | 0.821 | $0 | 0.00% | $0 | $0 | 0.00% | 0.00% | - | $70.00 | |||||||||||
| 2026-06-25 | AXTI | Amer. Xtal Tech. | Semiconductor | 99 | Small | $50.46 | -11.7986 | Wait for next Weekly Money Wave Close > 20 with High Volume. | 5100 | Long Term | Long | $0.00 | 0.00% | https://stockcharts.com/sc3/ui/?s=AXTI&a=2300207248&p=W&yr=0&mn=9&dy=0&id=p61016637531 | 2026-07-01 19:29:27 | open | 0.00% | 12456113 | Watch List | $0 | 0.00% | 0.00 | 0 | $0 | 0.00% | $0 | $0 | 0.00% | 0.00% | - | $105.00 |
Weekly Green Zone Pops – Click here for scrolling charts.
WEEKLY SWING TRADES
SELLS
IMRX Immuneering Corp. Target was Hit $7.50 with a 15.6 % Gain.
Completed Weekly Swing Trades thru Oct 2025: 38 Trades, +711.8% Total, or 18.7 % / Trade (before taxes & commissions).
______________________________________________________________________________
Important Links| Top 100 | Stage Chart Investing | CNN Fear & Greed Index |
| Dividend Growth Portfolio | ETF Sector Portfolio | Dogs of the Dow |
| Long Term Strategy | Stage Chart Investing | Articles |
Alert! Market Risk is Medium (Yellow). The probability of successful Short Term Trades is better, when the % of stocks above the 50-day avg. is below 20.
Tell your Friends about the Green Line, and Help Animals.
______________________________________________________________________________
QUESTION: Jeff writes “Hello, in trying to understand your DONT TAKE A LOSS comments, why don’t you raise the stop loss when the stock is up so much? I am not capturing a lot of upside as I get out conservatively (I stopped myself out at 20% on this trade). Is the point to let them run with a large stop loss to capture maximum upside?
ANSWER: Hi Jeff. When the Money Wave > 50, then the Stop is raised to the Buy Price. (Don’t Take a Loss!). The stock should have already bounced up 3-6 %, If not, EXIT and Wait for the next one (Fold like in poker, when you are dealt a bad hand).
Or you can hold on for more as long as the Reward / Risk ratio of 2:1 applies.
Thanks for writing.
ATGL
