Above the Green Line -01
  • Market Insights
        • Commentary
          • Daily
          • Weekly
        • BUY / SELL SIGNALS
          • Trade Posts
          • Recent Trade Alerts
          • Recent Day Trades
        • BLOGROLL
          • Dividend Growth Blog
          • ETF Sector Blog
          • Dow Dogs
          • TPOW Blog
  • Strategies
        • SWING TRADING
          • Current Positions
          • Watchlists
          • Closed Positions
          • Candidates - TOP 100
          • Specialty Stocks
        • WEEKLY STOCK PICK
          • TPOW Charts
          • TPOW Performance
          • TPOW Strategy Guide
          • TPOW Performance Dashboard
        • DAY TRADING
          • Watch List
        • ATGL DASHBOARD
        • ETF STRATEGIES
          • ETF Sector Rotation
          • ETF Sector Portfolio
        • DIVIDEND GROWTH
          • Dividend Growth Portfolio
          • Dividend Calendar
        • DOGS OF THE DOW
          • Dogs of the Dow Portfolio
          • DOW 5 Portfolio
  • Markets
        • US MARKET
          • Commodities
          • Energy
          • Precious Metals
          • Volatility
        • GLOBAL MARKETS
          • Market Indices
          • Economic Calendar
          • FOREX Heat Map
          • FOREX Cross Rates
          • Crypto Currency Market
  • Investing
    • Discord Community
    • Dashboard
  • Resources
        • ARTICLES
          • Dividend Growth Model Articles
          • ETF Articles
          • Investment Strategies Articles
          • Market and Economic Insights
          • Stock Trade Articles
          • Stock Reviews
        • TOOLS
          • Stock Scanners
          • Charting Software
          • Brokerage Firms
        • STOCK CHARTS
          • Key Components
          • Reading Charts
          • Drawing Stock Charts
          • Identifying Trends
        • RETIREMENT PLANNING
  • About
    • Contact Us
    • How to Win
    • #1 At Stockcharts
    • Disclaimer
    • FAQ
  • Log In
  • Subscribe

May 17, 2020

Green Line Weekly! May 17, 2020

SLV Chart
Will Silver (SLV) agree with Gold that Inflation is coming?


05/17/2020 Markets were down for the week as the S&P 500 Index failed to push up Above the Green Line.  The Markets have rolled over, but not much Selling for two reasons: 1.) Massive FED Printing and 2.) No Alternative Investment (NAI).  Swing Trading.

Most of the high Volume leaders that we suggested to Buy at the Lows in March (AAPL ADBE AMD JD MSFT NLOK NVDA PLUG SHOP & TSLA) have bounced 40 – 100 % and are now all in their weekly Red Zones (probably too late to Buy for the Short Term). Very few Leaders have made Higher Highs this week for the rally to continue. 

This could be a warning sign that Money is drying up, as most Weekly Charts are also back up in the Red Zones. 

The weaker Indices (DOW 30 Index, Small Caps, Transports, & NYSE) have rolled over and could easily drop back down to the March Lows. However, the Selling so far has not been very powerful. 

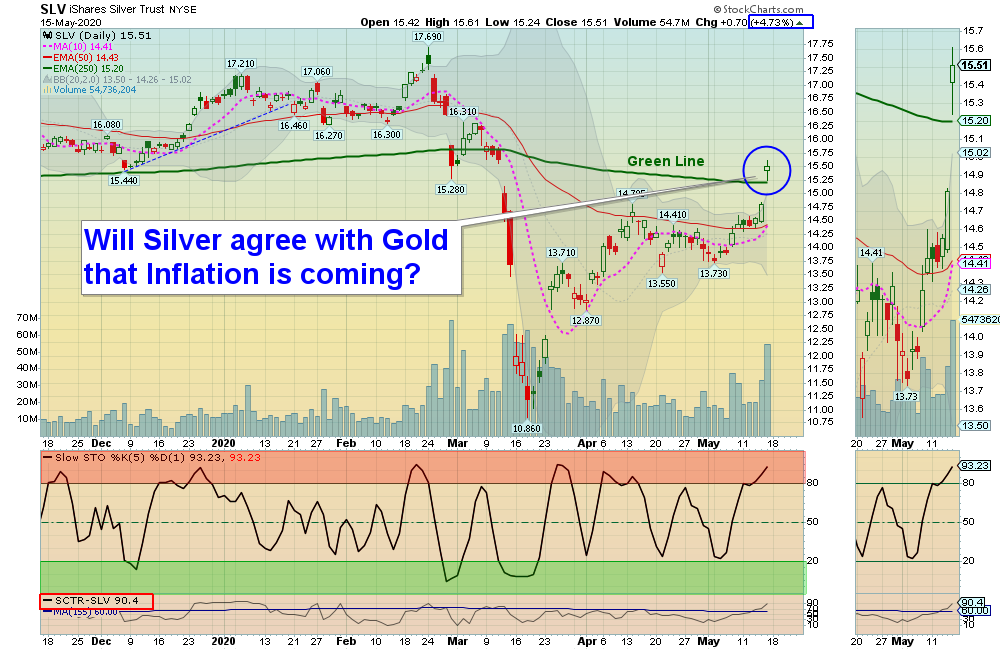
If the Economy improves, then historically Bonds would sell off and the lower prices on Bonds would make them more competitive with Stocks. Also with all of the FED Printing, Inflation could finally return and confirm why Gold and Gold Mining Funds (GDX) are making New Highs.

For the week the Dow was down 0.78%, the S&P 500 was down 2.26%, and the Nasdaq 100 was down 0.71%. The Long Term Trend for the Indices is mixed. 

The Inflation Index (CRB) was up 0.01% and is Below the Green Line, indicating Economic Weakness.

Bonds  were up 1.66% for the week and are Above the Green Line, indicating Economic Weakness.

The US DOLLAR was up 0.55 % for the week. 

Crude Oil was up 12.81% for the week at $29.52 and GOLD was up  2.47%  at $1756.30.

_____________________________________________________________________________________________

MONEY WAVE BUYS SOON:   

We are currently in 3 logged Open Positions, for the Short & Medium Term.  There are 6 Investments on the Short Term Watch List. 

Be patient and WAIT for Green Zone Buy Signals!

______________________________________________________________________________________________

LONG TERM INVESTMENTS  (Most of the Leaders are back up in the Weekly Red Zones.)

Buy the Leading Investments that are down near the Weekly Green Zones.     

AUY      YAMAHA GOLD      Wait for next Daily Green Zone Buy Signal.  All time High is $18.50.

GDX     GOLD MINING FUND      Wait for next Daily Green Zone Buy Signal.  All time High is $62.

KALA     KALA PHARM.          Wait for next Daily Green Zone Buy Signal.    

LLNW     LIMELIGHT NETWORKS      Buy if it Closes above $5.38 on High Volume.

______________________________________________________________________________________

Click for  Portfolio (Open Positions)
Click for  Watch List
Click for  Closed Positions


NEW DAY TRADE LIST MAY 15, 2020

TOP 100 LIST MAY 1, 2020

Dividend Growth Portfolio  (we are now posting a Dividend Calendar for the entire portfolio to assist with planning purposes).

ETF Sector Rotation System –  New Quarterly Rotation was on Apr 1, 2020.

Dogs of the DOW System

Long Term Strategy for IRAs & 401k Plans:   

Alert! Market Risk is MEDIUM (Yellow Zone). The probability of successful Short Term Trades is better, when the % of stocks above the 50-day avg. is below 20. 

Tell your Friends about the Green Line, and Help Animals

___________________________________________________________________________________________

QUESTION:  Peter writes “I am confused on this. Money Wave > 50. Don’t Take a Loss! What does that mean??”

ANSWER: Hi Peter, If the Money Wave is above 50, and the Investment is not popping up well, something could be wrong.

So Get Out before you lose money. Recently VXX went up 7 % in the morning and then reversed… We are saying: Get Out or Don’t Take a Loss, so you would have EXITED VXX at your Buy Price of $39.51.

Good trading and tell your friends!

Related Post

– Money Wave Weekly Recap – May 13,2020

Subscribe to Our Newsletter

AGL Logo

Get our eBook Now!

Candlestick - A Swing Traders Friend

We don’t spam! Read our privacy policy for more info.

You’ve been successfully subscribed to our newsletter!

Voted #1 at Stock Charts

SH Chart
Inverse S&P 500 Fund (SH) will have a Money Wave Buy today.

Help Us Help Animals

Help Us Help Animals

Recent Comments

  • Market Breadth Indicators: A Trader’s Guide to Early Trend Detection on Backtesting: Definition and How a Trading Strategy Backtest Works
  • Island Reversal Pattern: Definition and Formation Explained on Double Top Pattern: How to Identify and Trade This Reversal Signal
  • Channel Pattern Guide: What It Is and Why It Matters on A Guide to Forecasting Using Moving Averages
  • What Is a Broadening Bottom Chart Pattern? Full Guide on Bull vs. Bear Market: An Investor’s Guide to Market Phases
  • ATGL Weekly Money Flow - 2025-05-11 on ATGL Top Pick of the Week! Apr 6, 2025

Become a Green Liner!

Help me make more Money in the Stock Market.

ON ATGL

  • DashBoard
  • Weekly Commentary
  • Daily Buy / Sell Signals
  • Day Trade Setup
  • Trading Rooms

Design & Develop By Pixelvect

STRATEGIES

  • Swing Trading
  • ATGL Pick of the Week
  • Dividend Growth
  • ETF Sector Rotation
  • Dogs of the Dow

HELP

  • ATGL Trading Rules
  • FAQ
  • Account Maintenance
  • Contact US
  • Join

FOLLOW US

Instagram Linkedin Twitter Facebook

© COPYRIGHT 2024 · ABOVETHEGREENLINE.COM · ALL RIGHTS RESERVED · PRIVACY · TERMS · CONTACT · WATCHLIST · CURRENT