
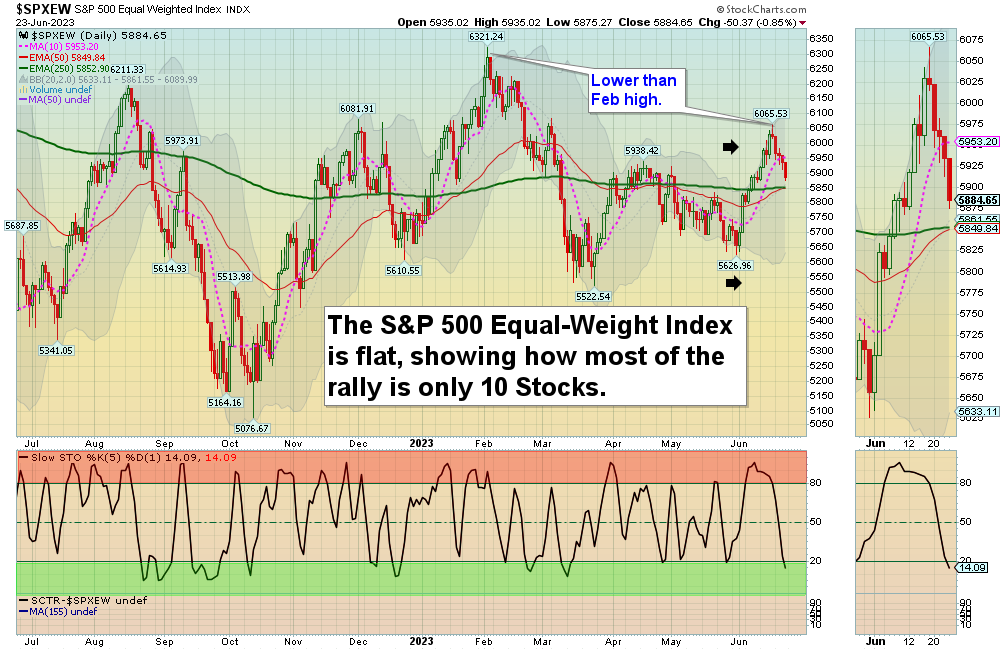
6/25/2023 Markets were lower for the week on normal profit taking. The strongest Leaders that made last week highs recently have pulled back down into the Green Zones for Buy Signals again next week (the Watch List has grown).Unfortunately many stocks did not make higher highs recently. The chart above shows that if all 500 stocks in the S&P 500 Index were weighted equally, then the broad Market is lower than the February high. Many are frustrated as the weaker stocks are not going up.
The broad Market is not going up because it now has competition. There are Trillions of Dollars now in Money Market Funds earning close to 5% interest, with no penalty for early withdrawal. The 3 month T-Bill Chart has gone up from 0% to 5.25% and should peak and historically will start back down when as the FED stops Tightening (raising short term Interest Rates).
The NASDAQ 100 Fund could be completing Wave 3 up with a count around $371, then a 38% correction down near the 50-day avg. (count of 339). Greed and FOMO (Fear of Missing Out) have taken over, so normally there will be some profit taking soon. Currently the CNN Fear & Greed Index, the Greed Index (SVXY), and the Fear Index (VIX) are all telling Smart Money to take profits and Raise CASH.
If you continue to Follow the Green Line System, your Money should flow into the Strongest areas and your account value should be able to grow in both Bull and Bear Markets. Follow the MONEY, not the MEDIA.
_____________________________________________________________________________________________
For the week the Dow was down 1.69%, the S&P 500 was down 1.42% and the NASDAQ 100 was own 1.33%. Many of the major Indices still have a Relative Strength below 80, so you should currently own the stronger Funds here.
The Inflation Index (CRB) was down 2.92% for the week and is Below the Green Line, indicating Economic Contraction.
Bonds were up 0.71% for the week, and are Below the Green Line, indicating Economic Expansion.
The US DOLLAR was up 0.69% for the week and is Below the Green Line.
Crude Oil was down 3.85% for the week at $69.16 and GOLD was down 2.11% at $199.60.
_____________________________________________________________________________________
We are now doing micro Day Trades on our new Discord site (free). Please join for mobile notifications during the day. Other methods of notification have been too Slow. Also, please check our our Live Streaming on YouTube during Market hours.
More action this week on the Day Trading Scrolling Charts, and DAY TRADING CHARTS FOR INDICES & LARGE CAPS.
_____________________________________________________________________________________________
MONEY BUYS SOON:
We are in now in 7 logged Swing Trading Positions for the Short & Medium Term. There are 7 investments on the Short Term Watch List.
Be patient and WAIT for Green Zone Buy Signals!
LONG TERM INVESTMENTS:
Long Term Scrolling Charts (Real Time)
ASRT ASSERTIO HOLDINGS Wait for Weekly Money Wave Close > 20 with High Volume.
CBAY CYMABAY THERA. Wait for Weekly Money Wave Close > 20 with High Volume.
CROX CROCS INC. Slipped below the Green Line and was Stopped Out. This trade was not logged.
EDU ORIENTAL EDUCATION GROUP Buy above $46.63 with High Volume with a 3% Trailing Sell Stop Loss below it.
HIMS HIMS & HERS HEALTH Wait for Weekly Money Wave Close > 20 with High Volume.
PINS PINTEREST INC. Buy above $29.27 with High Volume with a 3% Trailing Sell Stop Loss below it.
SH INVERSE S&P 500 FUND Buy above $17.71 with High Volume with a 3% Trailing Sell Stop Loss below it.
STNE STONECO LTD. Buy above $15.01 with High Volume with a 3% Trailing Sell Stop Loss below it.
TAL TAL EDUCATION GROUP Buy above $10.45 with High Volume with a 3% Trailing Sell Stop Loss below it.
__________________________________________________________________________________________
My Trading Dashboard
Swing Trading Scrolling Charts
Day Trading Scrolling Charts
Click for Watch Lists
Click for Current Positions
Click for Closed Positions
Updated Top 100 List Jun 1, 2023
Dividend Growth Portfolio
Updated ETF Sector Rotation System
Dogs of the DOW System
Long Term Strategy for IRAs & 401k Plans
CNN Fear & Greed Index
Scrolling Stage Chart Investing Charts
Alert! Market Risk is Medium (YELLOW). The probability of successful Short Term Trades is better, when the % of stocks above the 50-day avg. is below 20.
Tell your Friends about the Green Line, and Help Animals.
________________________________________________________________________________
QUESTION: Arvind writes “I joined the Green Line 2 days ago. How do I get a chart of my own ticker symbol?”
ANSWER: Hi Arvind, if you go down to the link on the Daily emails:
ARE YOUR INVESTMENTS ABOVE THE GREEN LINE?
You can pull up your own Charts. To make the CHARTS LARGER , input the Symbol, and scroll down to change the Size to Landscape, and then Click on the Update button.
Thank you,
ATGL
Related Post
– ASRT


