
6/18/2023 Markets were higher again for the week as the FED stopped Tightening (raising short term Interest Rates) at their meeting on Wed 14th. Many look at this as Good News. But in March, Dumb Money had FEAR when some banks got closed, and Sold. We like to Buy on FEAR, and take profits on GREED.
Now the FEAR is gone, and there has been panic Buying in some stocks. Greed and FOMO (Fear of Missing Out) has taken over, so normally there will be some profit taking soon. Currently the CNN Fear & Greed Index, the Greed Index (SVXY), and the Fear Index (VIX) are all telling Smart Money to take profits and Raise CASH.
If you continue to Follow the Green Line System, your Money should flow into the Strongest areas and your account value should be able to grow in both Bull and Bear Markets. Follow the MONEY, not the MEDIA.
_____________________________________________________________________________________________
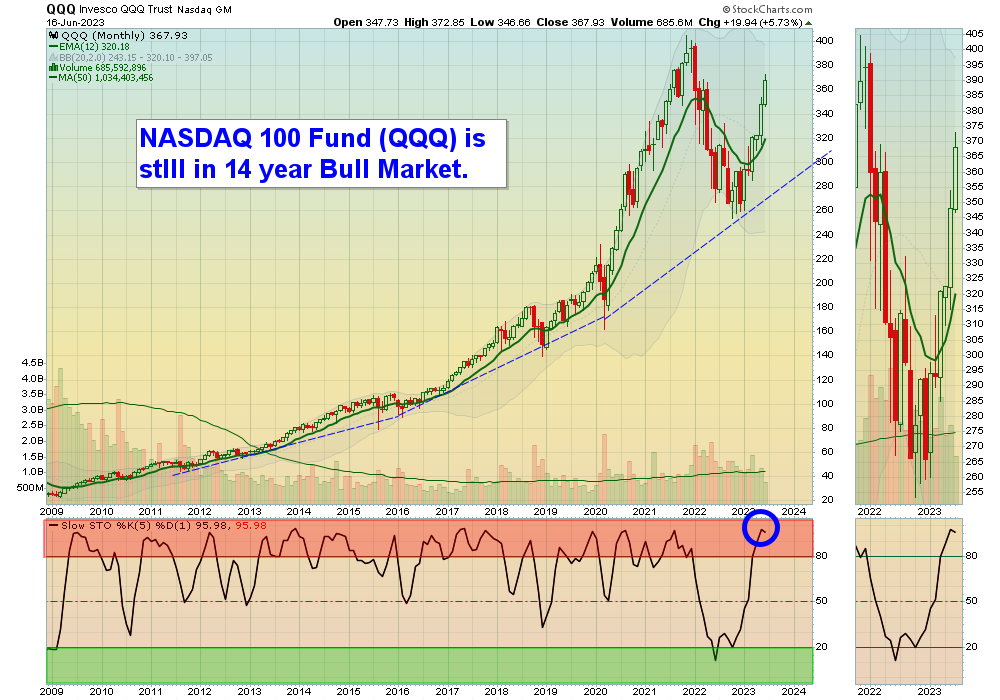
For the week the Dow was up 1.31%, the S&P 500 was up 2.60% and the NASDAQ 100 was up 3.79%. Many of the major Indices still have a Relative Strength below 80, so you should currently own the stronger Funds here.
The Inflation Index (CRB) was up 3.98% for the week and is Above the Green Line, indicating Economic Expansion.
Bonds were up 0.67% for the week, and are Below the Green Line, indicating Economic Expansion.
The US DOLLAR was down 1.64% for the week and is Below the Green Line.
Crude Oil was up 2.51% for the week at $71.93 and GOLD was down 0.30% at $1971.20.
_____________________________________________________________________________________
We are now doing micro Day Trades on our new Discord site (free). Please join for mobile notifications during the day. Other methods of notification have been too Slow. Also, please check our our Live Streaming on YouTube during Market hours.
More action this week on the Day Trading Scrolling Charts, and DAY TRADING CHARTS FOR INDICES & LARGE CAPS.
_____________________________________________________________________________________________
MONEY BUYS SOON:
We are in now in 9 logged Swing Trading Positions for the Short & Medium Term. There are 5 investments on the Short Term Watch List.
Be patient and WAIT for Green Zone Buy Signals!
LONG TERM INVESTMENTS:
Long Term Scrolling Charts (Real Time)
ASRT ASSERTIO HOLDINGS Wait for Weekly Money Wave Close > 20 with High Volume.
EDU ORIENTAL EDUCATION GROUP Buy above $46.63 with High Volume with a 3% Trailing Sell Stop Loss below it.
GERN GERON INC. Stopped Out this week when it Closed below the Red Line. The Target was already Hit for a 30.4% Gain.
HIMS HIMS & HERS HEALTH Wait for Weekly Money Wave Close > 20 with High Volume.
PINS PINTEREST INC. Buy above $29.27 with High Volume with a 3% Trailing Sell Stop Loss below it.
SH INVERSE S&P 500 FUND Buy above $17.71 with High Volume with a 3% Trailing Sell Stop Loss below it.
STLD STEEL DYNAMICS INC. Buy above $102.79 with High Volume with a 3% Trailing Sell Stop Loss below it.
STNE STONECO LTD. Buy above $15.01 with High Volume with a 3% Trailing Sell Stop Loss below it.
TAL TAL EDUCATION GROUP Buy above $10.45 with High Volume with a 3% Trailing Sell Stop Loss below it.
__________________________________________________________________________________________
My Trading Dashboard
Swing Trading Scrolling Charts
Day Trading Scrolling Charts
Click for Watch Lists
Click for Current Positions
Click for Closed Positions
Updated Top 100 List Jun 1, 2023
Dividend Growth Portfolio
Updated ETF Sector Rotation System
Dogs of the DOW System
Long Term Strategy for IRAs & 401k Plans
CNN Fear & Greed Index
Scrolling Stage Chart Investing Charts
Alert! Market Risk is High (RED). The probability of successful Short Term Trades is better, when the % of stocks above the 50-day avg. is below 20.
Tell your Friends about the Green Line, and Help Animals.
________________________________________________________________________________
QUESTION: Jose M writes “Morning, I seem to have difficulties on finding the Money Wave chart on the ETFs thanks.”
ANSWER: The Charts and Money Waves can be pulled up by clicking on the Symbol of the Investment on the Watch List or PORTFOLIO links in every Daily email.
The Money Wave is the Red and Green Zone on the bottom part of the Chart. Buy when the Money Wave has gone down into the Green Zone, and then turns up above 20. (See Chart below, and Black Arrow indicates a Buy Signal).
Related Post
– EDU


