
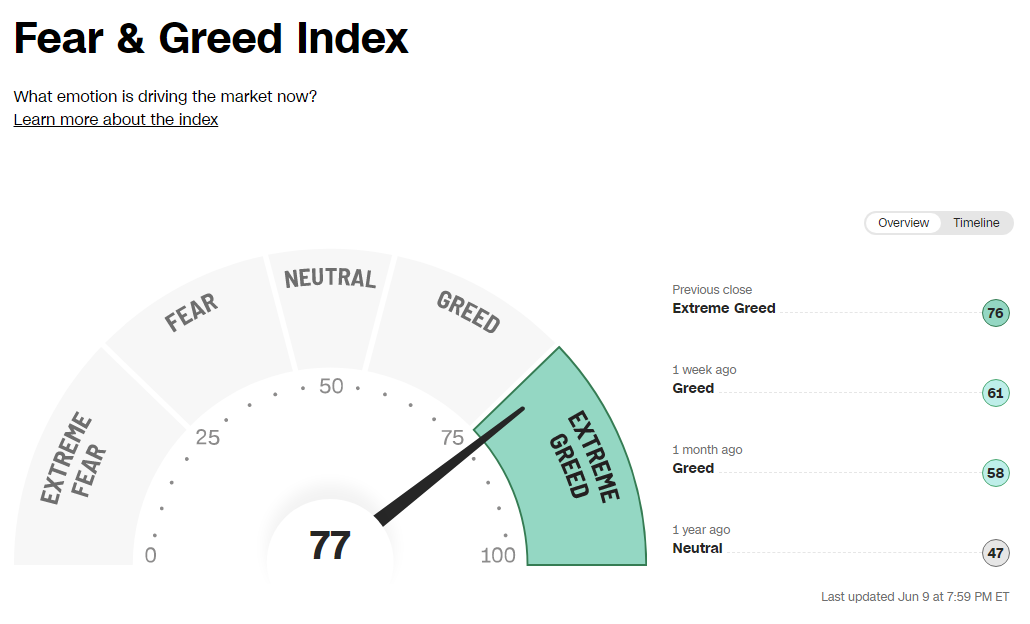
6/11/2023 Markets were slightly higher for the week as the FEAR has gone, and there has been panic Buying in some stocks. FOMO (Fear of Missing Out) has taken over and Greed has returned. We like to Buy on FEAR (like in March), and take profits on GREED. Currently the CNN Fear & Greed Index, the Greed Index (SVXY), and the Fear Index (VIX) are all telling Smart Money to take profits and Raise CASH.
The Herd is hoping that the FED will stop Tightening at their meeting on Wed 14th, but the Markets have become emotionally over bought from the panic Buying (Fear Index VIX < $14 + the Leaders are Way Above the Green Lines). Smart Money is Raising CASH and will Buy on the next FEAR Flush like in March, and then Smart Money will Buy again, on FEAR.
If you continue to Follow the Green Line System, your Money should flow into the Strongest areas and your account value should be able to grow in both Bull and Bear Markets. Follow the MONEY, not the MEDIA.
_____________________________________________________________________________________________
For the week the Dow was up 0.35%, the S&P 500 was up 0.46% and the NASDAQ 100 was down -0.40%. Many of the major Indices still have a Relative Strength below 80, so you should currently own the stronger Funds here.
The Inflation Index (CRB) was up 0.33% for the week and is Below the Green Line, indicating Economic Contraction.
Bonds were down 0.07% for the week, and are Below the Green Line, indicating Economic Expansion.
The US DOLLAR was down 0.40% for the week and is Above the Green Line.
Crude Oil was down 2.19% for the week at $70.71 and GOLD was up 0.39% at $1977.20.
_____________________________________________________________________________________
Completed Trades this week:
CEMEX SA CX Target Hit at $6.75 for an 8.3 % Gain.
DRAFTKINGS INC. DKNG Target was Hit at $25.50 for a 4.4% Gain.
MEXICO FUND EWW Target was Hit at $62.50 for a 2.1% Gain.
SHOPIFY INC. SHOP Target was Hit at $64 for an 8% Gain.
VIPSHOP HOLDINGS VIPS Target was Hit at $17 for a 6.2% Gain.
We are now doing micro Day Trades on our new Discord site (free). Please join for mobile notifications during the day. Other methods of notification have been too Slow. Also, please check our our Live Streaming on YouTube during Market hours.
More action this week on the Day Trading Scrolling Charts, and DAY TRADING CHARTS FOR INDICES & LARGE CAPS.
_____________________________________________________________________________________________
MONEY BUYS SOON:
We are in now in 7 logged Swing Trading Positions for the Short & Medium Term. There are 6 investments on the Short Term Watch List.
Be patient and WAIT for Green Zone Buy Signals!
LONG TERM INVESTMENTS:
Long Term Scrolling Charts (Real Time)
CROX CROCS INC. Up 5.6% on the Weekly Money Wave Buy Signal, but Volume was not High.
EDU ORIENTAL EDUCATION GROUP Buy above $46.63 with High Volume with a 3% Trailing Sell Stop Loss below it.
HIMS HIMS & HERS HEALTH Wait for Weekly Money Wave Close > 20 with High Volume.
PINS PINTEREST INC. Buy above $29.27 with High Volume with a 3% Trailing Sell Stop Loss below it.
SH INVERSE S&P 500 FUND Buy above $17.71 with High Volume with a 3% Trailing Sell Stop Loss below it.
STLD STEEL DYNAMICS INC. Buy above $102.79 with High Volume with a 3% Trailing Sell Stop Loss below it.
STNE STONECO LTD. Buy above $15.01 with High Volume with a 3% Trailing Sell Stop Loss below it.
TAL TAL EDUCATION GROUP Buy above $10.45 with High Volume with a 3% Trailing Sell Stop Loss below it.
__________________________________________________________________________________________
My Trading Dashboard
Swing Trading Scrolling Charts
Day Trading Scrolling Charts
Click for Watch Lists
Click for Current Positions
Click for Closed Positions
Updated Top 100 List Jun 1, 2023
Dividend Growth Portfolio
Updated ETF Sector Rotation System
Dogs of the DOW System
Long Term Strategy for IRAs & 401k Plans
CNN Fear & Greed Index
Scrolling Stage Chart Investing Charts
Alert! Market Risk is Medium (YELLOW). The probability of successful Short Term Trades is better, when the % of stocks above the 50-day avg. is below 20.
Tell your Friends about the Green Line, and Help Animals.
________________________________________________________________________________
QUESTION: Peter W. writes “When you say the RSI should be “ABOVE 90 R S “. I look at your chart and it shows SCTR 90, not RSI. Please clarify.
ANSWER: Hi Peter. We don’t use RSI, which is a technical oscillator. We use Relative Strength compared to the Market (StockChart’s SCTR):
Q: Where do I find the Relative Strength Factor in StockCharts.com so I can add it to my charts?
A: Relative Strength Values comes from the SCTR Rank (StockCharts Technical Rank), www.etfscreen.com for ETFs , and Investor’s Business Daily (IBD) for stocks. We prefer the longer term weighting used by www.etfscreen.com and IBD. We sometimes use a 155-day avg. of StockCharts SCTR, which is at the bottom left of many charts (just below the SCTR Rank) to simulate R S closer to the longer term ranking of IBD ranking.
Good trading, and tell your friends!
ATGL
Related Post
– CROX


